


Gold Technical Price Outlook: XAU/USD Short-term Trade Levels
- Gold price updated technical trade levels – Daily & Intraday Charts
- XAU/USD rebound off downtrend support now testing downtrend resistance- breakout pending
- New to Gold Trading? Get started with this Free How to Trade Gold -Beginners Guide
Gold prices rallied more than 0.8% since the start of the week with XAU/USD trading at 1790 ahead of the US open on Tuesday. The advance takes price into technical downtrend resistance and we’re looking for a breakout of the weekly / August opening-range for guidance in the days ahead. These are the updated targets and invalidation levels that matter on the XAU/USD short-term technical charts. Review my latest Strategy Webinar for an in-depth breakdown of this gold technical setup and more.
Gold Price Chart - XAU/USD Daily

Chart Prepared by Michael Boutros, Technical Strategist; Gold on Tradingview
Technical Outlook: In my last Gold Price Outlook we noted that the XAU/USD, “rebound off downtrend support is now testing downtrend resistance- looking for a reaction up here in the days ahead of guidance.” Price continued to hold just below resistance at the January low-week close at 1791 and we’re awaiting the breakout for guidance. Key daily support now rests with the monthly open / monthly opening-range low at 1753/61.
Gold Price Chart - XAU/USD 240min
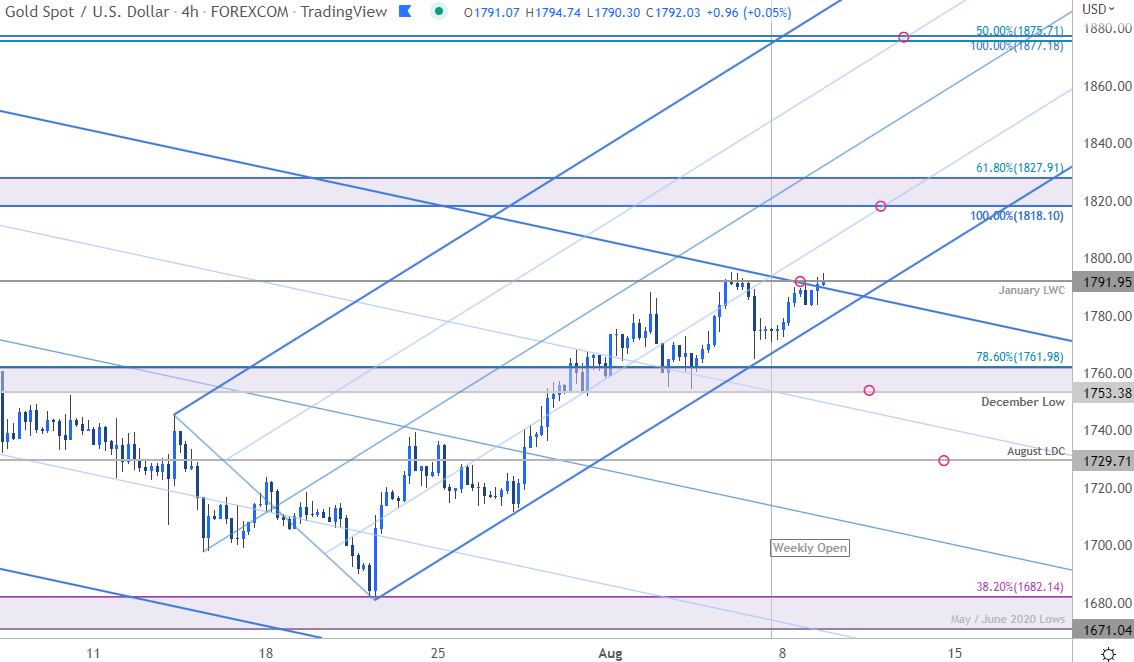
Notes: A closer look at Gold price action shows XAU/USD continuing to trade within the confines of an embedded ascending pitchfork formation extending off the July lows. A topside breach / close above 1791 would expose a key Fibonacci confluence at 1671/82- look for a larger reaction there IF reached with a close above needed to keep the long-bias viable towards 1875/77. Initial support rests with the lower parallel backed by 1753/61 – losses beyond this threshold would once again threaten resumption of the broader downtrend towards the August low-day close at 1729 and 1671/82.

Bottom line: The gold price rebound off downtrend support is holding just below downtrend resistance with the weekly / monthly opening-range in focus- we’re looking for possible price inflection here. From a trading standpoint, losses should be limited to 1753 IF price is indeed heading higher on this stretch with a close above 1827 needed to suggest a larger trend reversal is underway in Gold. Stay nimble heading into key US inflation data with the releases likely to fuel added volatility in gold. Review my latest Gold Weekly Price Outlook for a closer look at the longer-term XAU/USD technical trading levels.
For a complete breakdown of Michael’s trading strategy, review his Foundations of Technical Analysis series on Building a Trading Strategy
Gold Trader Sentiment – XAU/USD Price Chart

- A summary of IG Client Sentiment shows traders are net-long Gold- the ratio stands at +3.46 (77.59% of traders are long) – typically bearishreading
- Long positions are1.34% lower than yesterday and 13.20% lower from last week
- Short positions are22.40% higher than yesterday and 36.58% higher from last week
- We typically take a contrarian view to crowd sentiment, and the fact traders are net-long suggests Gold prices may continue to fall. Yet traders are less net-long than yesterday and compared with last week. From a sentiment standpoint, the recent changes in positioning warn that the current Gold price trend may soon reverse higher despite the fact traders remain net-long.
| Change in | Longs | Shorts | OI |
| Daily | 1% | -3% | -1% |
| Weekly | 2% | -8% | -2% |
Economic Calendar

Economic Calendar - latest economic developments and upcoming event risk.
Active Technical Setups
- Canadian Dollar Short-term Price Outlook: USD/CAD Rebound Faces NFP
- Crude Oil Short-term Outlook: WTI Spills Lower- Support in View
- Nasdaq Technical Outlook: NDX Fed Rally Faces Downtrend Resistance
- EUR/USD Short-term Technical Outlook: Euro Recovery Stalls into Fed
- Dow Jones Technical Forecast: DJI Rebound Faces Downtrend Resistance
- Written by Michael Boutros, Technical Strategist with DailyFX
Follow Michael on Twitter @MBForex


