


Nasdaq Technical Price Outlook: Short-term Trade Levels
- Nasdaq technical trade level update – Daily & Intraday Charts
- NDX rally off downtrend support testing downtrend resistance- risk for price inflection
- Resistance 12630, 12854(key), 13225- Support 12041, 11520/658 (critical), 11127
The Nasdaq has rallied more than 14.7% off the lows with the index now approaching confluent, downtrend resistance. This is the first real test of the June rally and we’re on the lookout for possible price inflection into the close of the week / month. These are the targets and invalidation levels that matter on the Nasdaq technical price charts into the close of the week. Review my latest Strategy Webinar for an in-depth breakdown of this NDX technical setup and more.
Nasdaq Price Chart – NDX Daily

Chart Prepared by Michael Boutros, Technical Strategist; Nasdaq on Tradingview
Technical Outlook: The Nasdaq has been trading within the confines of a descending pitchfork formation extending off the 2021 highs – a reversal just ahead of the lower parallel in June has rallied into confluent downtrend resistance at the 100% extension of the advance at 12630. We’re on the lookout for possible price inflection here. A topside breach / close above the April low-close at 12854 would be needed to validate a larger breakout. That said, the immediate advance is vulnerable while below.
Nasdaq Price Chart – NDX 240min

Chart Prepared by Michael Boutros, Technical Strategist; Nasdaq on Tradingview
Notes: A closer look at short-term Nasdaq price action shows the index rallying into confluence resistance on the heels of yesterday’s Fed rate decision. Initial support rests at 12041 backed by 11520/685- a break / close below this threshold would be needed to mark resumption of the braoder downtrend with such a scneario exposing subsequent support objectives at the yearly low-day close at 11127 and the 61.8% Fibonacci retracement of the 2020 advance at 10589.
A topside breach of this formation into the August open would suggest a more significant low was registered last month and shift the focus towards initial resistance at the 38.2% retracement at 13225- look for a larger reaction there IF reached.

Bottom line: A recovery off downtrend support takes the Nasdaq into downtrend resistance and we’re looking for possible inflection up here into the close of the week / month. From a trading standpoint, a good region to reduce long-exposure / raise protective stops – losses should be limited to 12041 IF price is heading higher on this stretch. That said, we’re on the lookout for possible topside exhaustion on a stretch higher here – rallies should be capped by 12854 for the broader short-bias to remain viable. Review my last Nasdaq Weekly Technical Forecast for a closer look at the longer-term SPX 500 technical trade levels.
For a complete breakdown of Michael’s trading strategy, review his Foundations of Technical Analysis series on Building a Trading Strategy
Economic Calendar
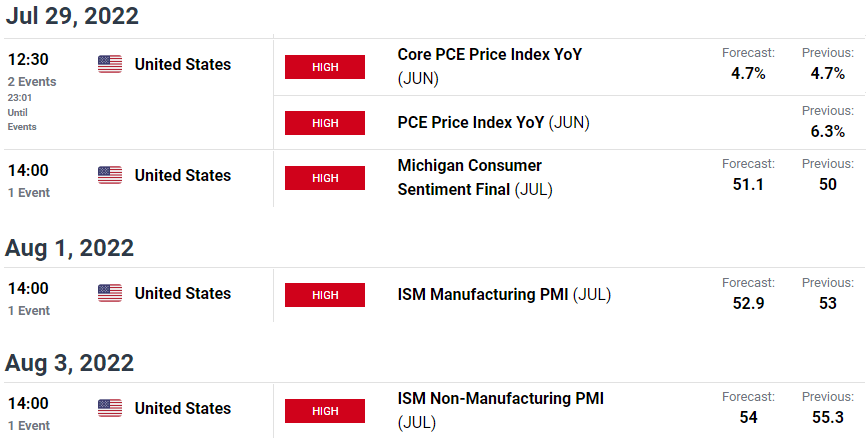
Economic Calendar - latest economic developments and upcoming event risk.
Active Technical Setups
- EUR/USD Short-term Technical Outlook: Euro Recovery Stalls into Fed
- Gold Price Technical Outlook: Gold Support in Focus– XAU/USD Fed Levels
- Dow Jones Technical Forecast: DJI Rebound Faces Downtrend Resistance
- Canadian Dollar Price Outlook: USD/CAD Reversal Slams into Support
- Crude Oil Technical Outlook: WTI Spills into Last Lines of Support
- S&P 500 Forecast: Stocks Plunge, SPX Technical Support at July Lows
-Written by Michael Boutros, Technical Strategist with DailyFX
Follow Michael on Twitter @MBForex


