


Gold Technical Price Outlook: XAU/USD Short-term Trade Levels
- Gold price updated technical trade levels – Daily & Intraday Charts
- XAU/USD rebound off downtrend support falters at resistance post-NFP
- New to Gold Trading? Get started with this Free How to Trade Gold -Beginners Guide
Gold prices surged nearly 6.7% off the yearly lows with a rebound off support faltering at downtrend resistance on the heels of a blow-out US Non-Farm Payroll release today. The battle-lines have been drawn and the focus is on a breakout of the initial August opening-range in the days ahead. These are the updated targets and invalidation levels that matter on the XAU/USD short-term technical charts. Review my latest Strategy Webinar for an in-depth breakdown of this gold technical setup and more.
Gold Price Chart - XAU/USD Daily
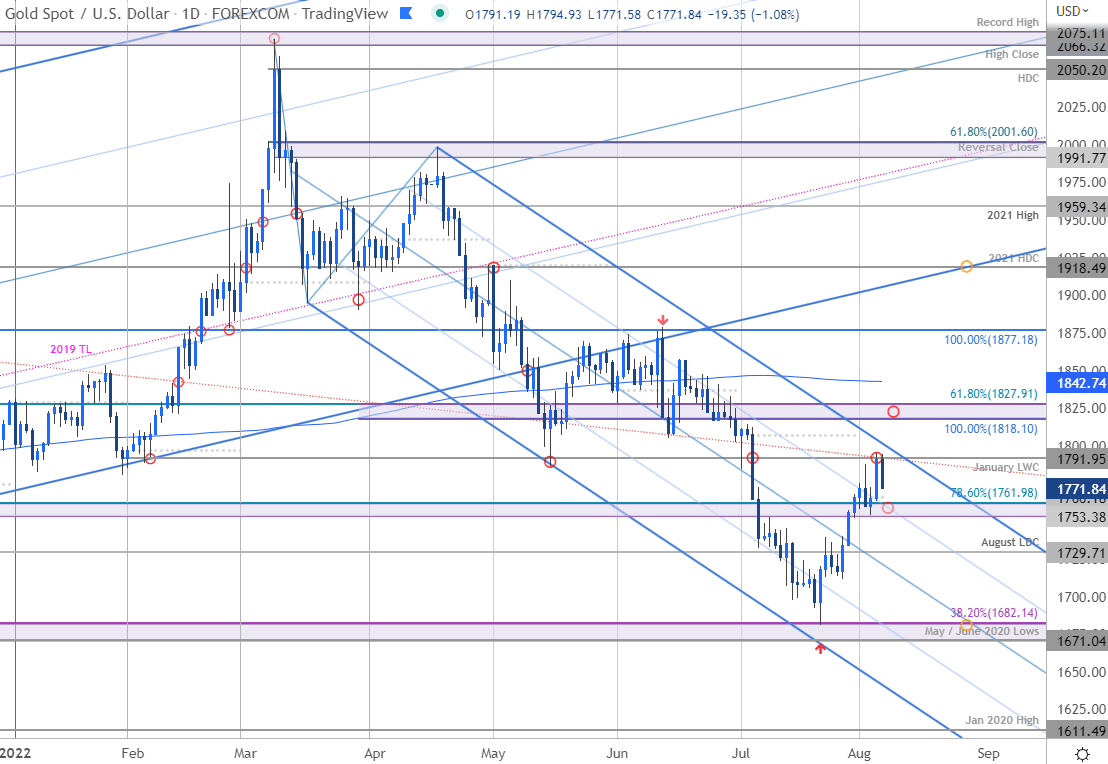
Chart Prepared by Michael Boutros, Technical Strategist; Gold on Tradingview
Technical Outlook: In my last Gold Price Outlook we noted that XAU/USD had, “rebounded off confluent downtrend support with major event risk on tap into the close of the week / month. From at trading standpoint, look for downside exhaustion ahead of the yearly low-close at 1696 IF price is heading higher on this recovery with a breach above the weekly range highs needed to fuel the push.” Gold registered a low at 1711 the following day before mounting an outside-daily reversal higher with the price rallying more than 4.8% into the August open. That rally is now approaching yearly downtrend resistance and we’re looking for possible price inflection up here for guidance in the days ahead.
Gold Price Chart - XAU/USD 240min

Notes: A closer look at Gold price action shows XAU/USD trading within the confines of an embedded ascending median-line formation extending off the July lows. Price is testing the yearly downtrend here- a topside breach would keep the focus on resistance at the 1818/27 Fibonacci confluence– a daily close above this threshold would be needed to suggest a more significant low is in / validate a larger medium-term trend reversal towards 1877/75. Initial support now rests at 1753 with a break below the August low-day close at 1729 needed to mark resumption of the broader downtrend towards the median-line (~1700) and key support at the May / June 2020 lows at 1671/82.

Bottom line: The gold price rebound off downtrend support is now testing downtrend resistance- looking for a reaction up here in the days ahead of guidance. From at trading standpoint, a good zone to reduce portions of long-exposure / raise protective stops – losses should be limited to 1729 IF price is indeed heading higher on this stretch with a close above 1827 needed to clear the way. Review my latest Gold Weekly Price Outlook for a closer look at the longer-term XAU/USD technical trading levels.
For a complete breakdown of Michael’s trading strategy, review his Foundations of Technical Analysis series on Building a Trading Strategy
Gold Trader Sentiment – XAU/USD Price Chart
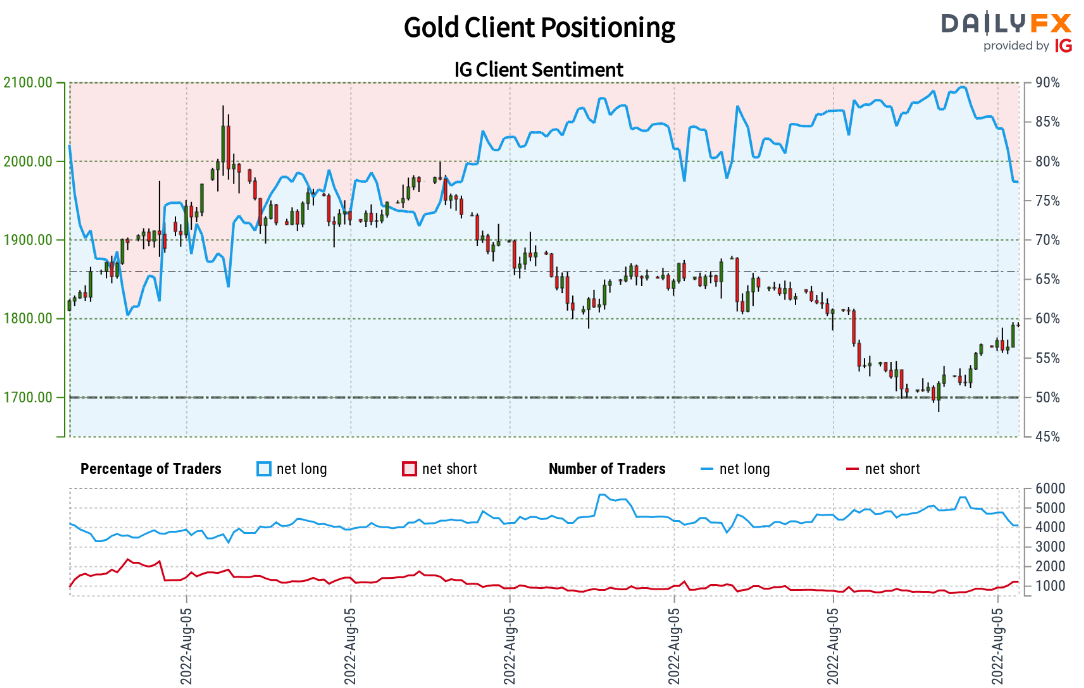
- A summary of IG Client Sentiment shows traders are net-long Gold- the ratio stands at +3.39 (77.22% of traders are long) – typically bearishreading
- Long positions are4.24% lower than yesterday and 16.43% lower from last week
- Short positions are22.74% higher than yesterday and 52.69% higher from last week
- We typically take a contrarian view to crowd sentiment, and the fact traders are net-long suggests Gold prices may continue to fall. Yet traders are less net-long than yesterday and compared with last week. From a sentiment standpoint the recent changes in positioning warn that the current Gold price trend may soon reverse higher despite the fact traders remain net-long.
| Change in | Longs | Shorts | OI |
| Daily | 1% | -3% | -1% |
| Weekly | 2% | -8% | -2% |
Economic Calendar
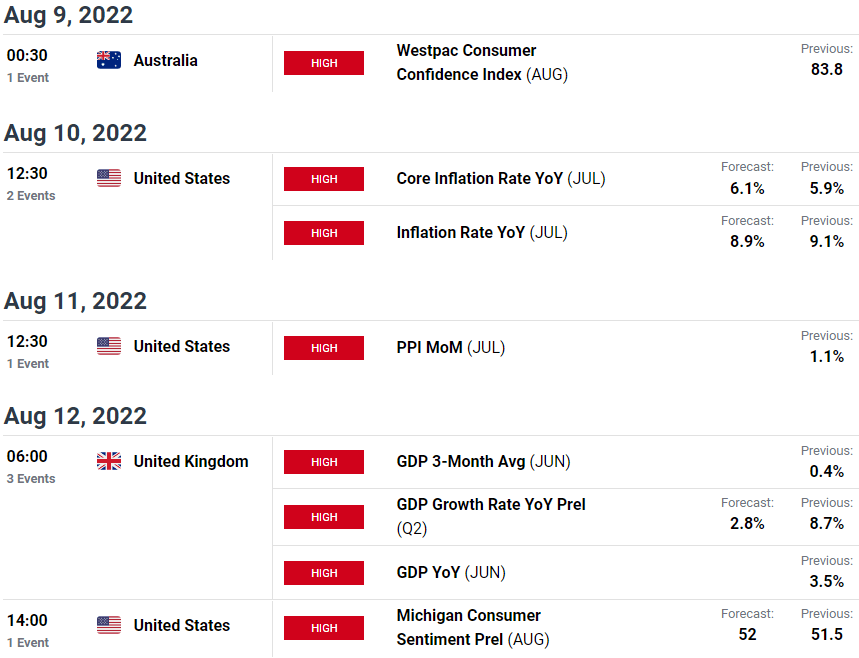
Economic Calendar - latest economic developments and upcoming event risk.
Active Technical Setups
- Canadian Dollar Short-term Price Outlook: USD/CAD Rebound Faces NFP
- Crude Oil Short-term Outlook: WTI Spills Lower- Support in View
- Nasdaq Technical Outlook: NDX Fed Rally Faces Downtrend Resistance
- EUR/USD Short-term Technical Outlook: Euro Recovery Stalls into Fed
- Dow Jones Technical Forecast: DJI Rebound Faces Downtrend Resistance
- Written by Michael Boutros, Technical Strategist with DailyFX
Follow Michael on Twitter @MBForex


