Gold Price Outlook:
- Gold prices are being held back by a rebound in real yields as inflation expectations ease back.
- Gold prices remain above 1835, and have sustained gains despite clocking a bearish key reversal on Tuesday’s daily candlestick.
- According to the IG Client Sentiment Index, gold prices still have a bullish bias in the near-term.


Resiliency Shining Through
Gold prices remain above the critical 1835 level, which was the demarcation line for bullish breakout territory (see: Gold Price Forecast: Nearing Long-term Trendline, Inverse Head and Shoulders Neckline - Levels for XAU/USD). The resiliency seen in gold prices in recent days is noteworthy, considering that their primary driver, lower real yields, has backed off as inflation expectations have eased back.
Moreover, gold prices are proving resilient in context of technical developments. Tuesday’s daily candlestick formed into a bearish key reversal, yet there has been no follow through lower, suggesting that a near-term top may not have been reached. Considering gold prices are holding onto their strength despite seasonality studies showing that November has been the worst month of the year for gold prices, bullion may be well-positioned to continue its rally in the coming weeks and months; December and January have been two of the best months of the year for gold prices in the QE era.
Gold Volatility and Gold Prices’ Normal Relationship
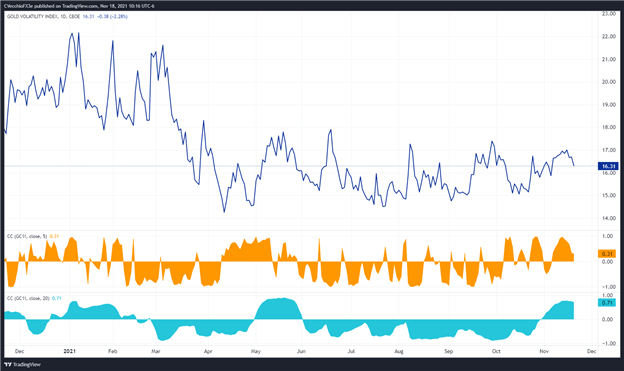
Historically, gold prices have a relationship with volatility unlike other asset classes. While other asset classes like bonds and stocks don’t like increased volatility – signaling greater uncertainty around cash flows, dividends, coupon payments, etc. – gold tends to benefit during periods of higher volatility. Gold volatility pulling back has coincided with the gold price rally stalling, not an unusual set of circumstances.
GVZ (Gold Volatility) Technical Analysis: Daily Price Chart (November 2020 to November 2021) (Chart 1)

Gold volatility (as measured by the Cboe’s gold volatility ETF, GVZ, which tracks the 1-month implied volatility of gold as derived from the GLD option chain) was trading at 16.31 at the time this report was written.
The relationship between gold prices and gold volatility appears typical relative to historic norms, with the 20-day correlation holding near its strongest level since early-June. The 5-day correlation between GVZ and gold prices is +0.31 while the 20-day correlation is +0.71. One week ago, on November 11, the 5-day correlation was +0.96 and the 20-day correlation was +0.77.
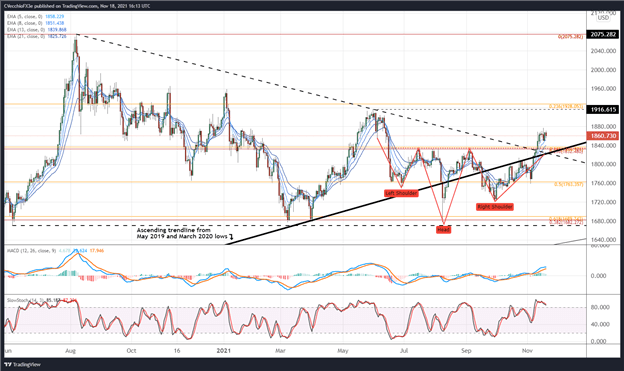
Gold Price Rate Technical Analysis: Daily Chart (May 2020 to November 2021) (Chart 2)

In spite of the daily key reversal that formed on Tuesday, gold prices are still exhibiting signs of a bullish technical structure in the near-term. The sideways shuffle experienced over the past week indicates a bull flag may be forming after the initial bullish breakout, putting into focus higher gold prices in the near-future.
Technical studies of momentum continue to point higher. Gold prices are above their daily 5-, 8-, 13-, and 21-EMA envelope, which is in bullish sequential order. Daily MACD is still rising while above its signal line, and daily Slow Stochastics are holding in overbought territory.
A move through Tuesday’s high of 1877.14 would signal the continuation of the bullish breakout move back towards the August high at 1916.62.
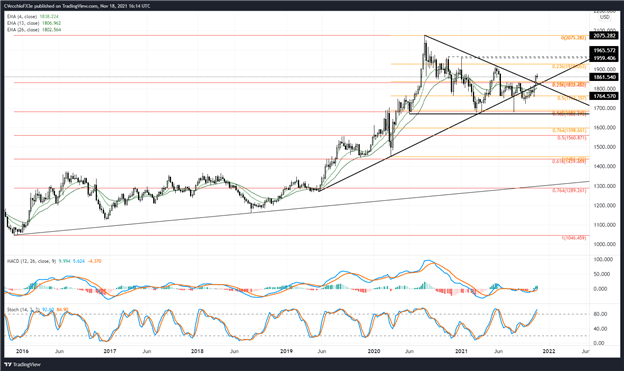
Gold Price Technical Analysis: Weekly Chart (October 2015 to November 2021) (Chart 3)

It’s been previously noted that “the 1835 level may soon be broken warranting a shift in the longer-term outlook from neutral to bullish.” Accordingly, as long as gold prices remain above 1835, higher prices will be expected. Gold prices’ technical structure on the weekly timeframe is directionally bullish. Gold prices are above the weekly 4-, 13-, and 26-EMA envelope, which is in bullish sequential order. Weekly MACD continues to climb through its signal line, while weekly Slow Stochastics are holding in overbought territory for the first time since late-May.


IG CLIENT SENTIMENT INDEX: GOLD PRICE FORECAST (November 18, 2021)
Gold: Retail trader data shows 65.45% of traders are net-long with the ratio of traders long to short at 1.89 to 1. The number of traders net-long is 5.95% lower than yesterday and 1.40% lower from last week, while the number of traders net-short is 3.02% higher than yesterday and 2.52% higher from last week.
We typically take a contrarian view to crowd sentiment, and the fact traders are net-long suggests Gold prices may continue to fall.
Yet traders are less net-long than yesterday and compared with last week. Recent changes in sentiment warn that the current Gold price trend may soon reverse higher despite the fact traders remain net-long.
--- Written by Christopher Vecchio, CFA, Senior Strategist


