


Gold Technical Price Outlook: XAU/USD Weekly Trade Levels
- Gold price updated technical trade levels - Weekly Chart
- XAU/USD reverses off downtrend resistance– risk for deeper correction sub-1932
- New to Gold Trading? Get started with this Free How to Trade Gold -Beginners Guide
Gold prices are down more than 3.2% off the October highs with XAU/USD trading at 1871 in early New York trade today. A break of the monthly opening-range this week threatens a larger sell-off in price with the bears now eyeing the September lows. These are the updated targets and invalidation levels that matter on the gold weekly charts heading into the US Presidential Elections next week. Review my latest Weekly Strategy Webinar for an in-depth breakdown of this gold technical setup and more.
Gold Price Chart - XAU/USD Weekly
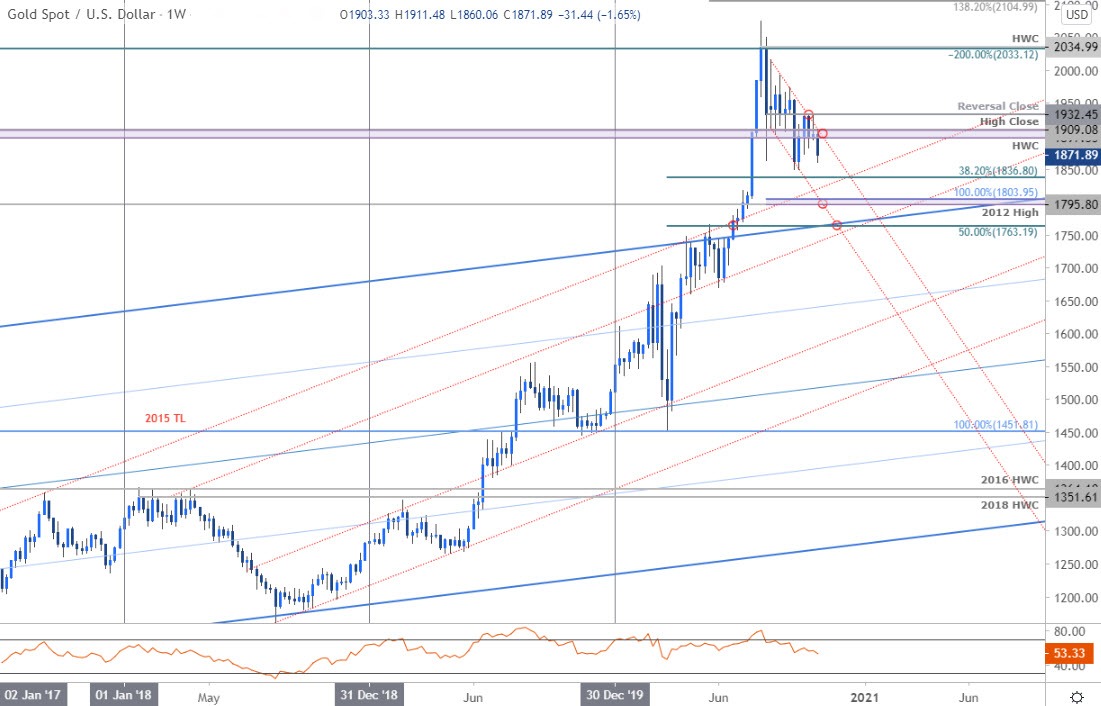
Chart Prepared by Michael Boutros, Technical Strategist; Gold on Tradingview
Notes: In my last Gold Weekly PriceOutlook we noted that XAU/USD had, “have rebounded off channel support with the recovery now approaching downtrend resistance- look for inflection on a test of 1932 for guidance.. be on the lookout for topside exhaustion into channel resistance IF prices is still heading lower.” Gold registered a high at 1933 just days later before reversing with price breaking back below the 1897-1909 pivot zone this week.
Weekly support objectives remain unchanged at the 38.2% Fibonacci retracement of the yearly range at 1836 and the 2012 high / 100% extension at 1795-1803 (critical). Resistance now stands back at the 2011 high-close at 1909 with bearish invalidation now lowered to the August weekly reversal-close at 1932.

Bottom line: Gold prices have reversed off confluence downtrend resistance but keeps XAU/USD within a broader September range. From at trading standpoint, a break of the October opening-range does highlight the risk of a deeper sell-off into the close of the month with initial support objectives now in view. That said, there is significant event risk on tap with the US Presidential Elections on tap next week and we’ll need to respect a breakout / weekly close above of this formation to invalidate the multi-month downtrend- stay nimble. Look for a larger reaction off ~1800s IF reached for guidance. Review my latest Gold Price Outlook for a closer look at the near-term XAU/USD technical trading levels.
For a complete breakdown of Michael’s trading strategy, review his Foundations of Technical Analysis series on Building a Trading Strategy
Gold Trader Sentiment – XAU/USD Price Chart

- A summary of IG Client Sentiment shows traders are net-long Gold- the ratio stands at +4.82 (82.82% of traders are long) – bearishreading
- Long positions are3.93% higher than yesterday and 9.62% higher from last week
- Short positions are8.15% lower than yesterday and 15.53% lower from last week
- We typically take a contrarian view to crowd sentiment, and the fact traders are net-long suggests Gold prices may continue to fall. Traders are further net-long than yesterday and last week, and the combination of current positioning and recent changes gives us a stronger Gold-bearish contrarian trading bias from a sentiment standpoint.
| Change in | Longs | Shorts | OI |
| Daily | 1% | -3% | -1% |
| Weekly | 2% | -8% | -2% |
---
Previous Weekly Technical Charts
- Japanese Yen (USD/JPY)
- Australian Dollar (AUD/USD)
- British Pound (GBP/USD)
- Euro (EUR/USD)
- Australian Dollar (AUD/USD)
- Canadian Dollar (USD/CAD)
- Written by Michael Boutros, Currency Strategist with DailyFX
Follow Michael on Twitter @MBForex


