


Japanese Yen Technical Price Outlook: USD/JPY Weekly Trade Levels
- Japanese Yen technical trade levels update – Weekly Chart
- USD/JPY downtrend testing critical support pivot at 104.12
- Key resistance now 105.59 – break lower exposes 103.43
The Japanese Yen is attempting to mark a third consecutive weekly advance against the US Dollar with USD/JPY down 0.34% ahead of the New York close on Wednesday. A break of the October monthly opening-range lows takes price into a pivotal support zone and leaves the immediate decline vulnerable near-term. These are the updated targets and invalidation levels that matter on the USD/JPY weekly price chart. Review my latest Weekly Strategy Webinar for an in-depth breakdown of this Yen trade setup and more.
Japanese Yen Price Chart – USD/JPY Weekly
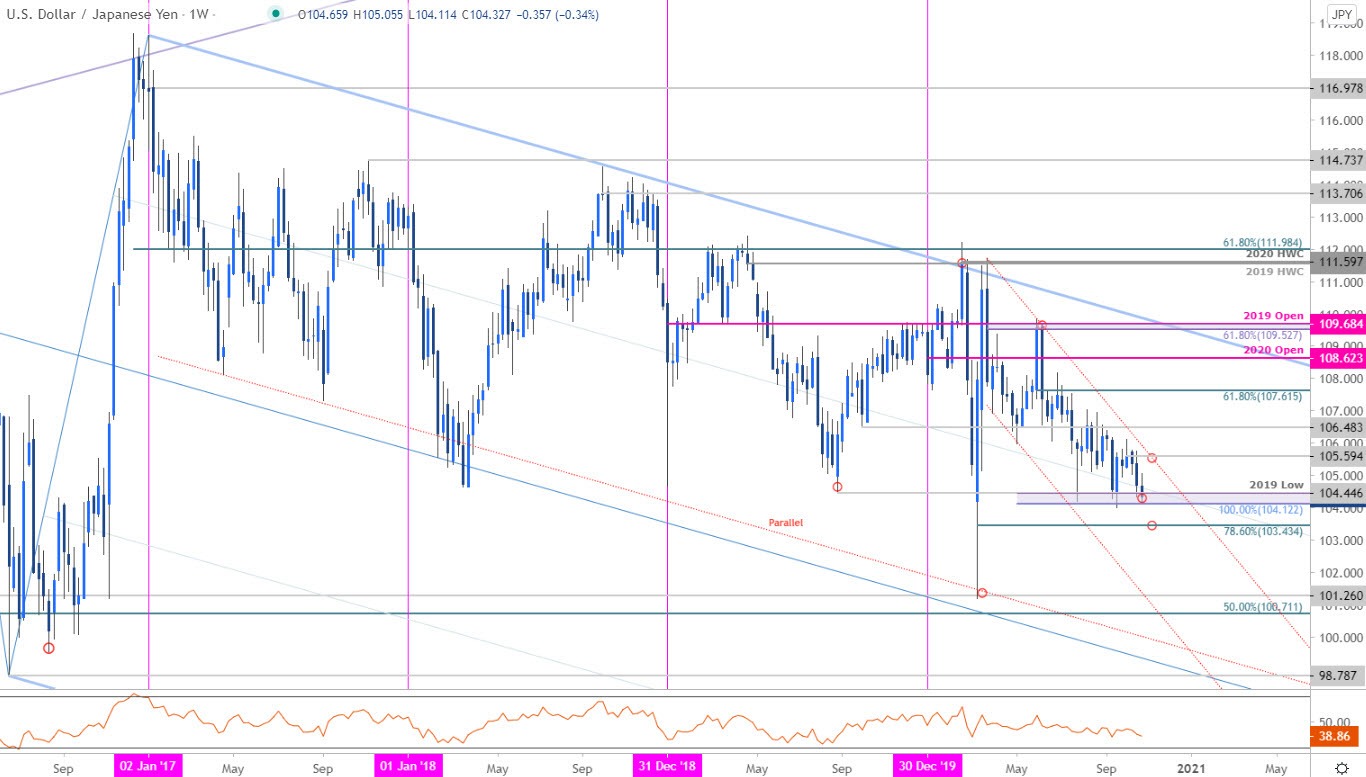
Chart Prepared by Michael Boutros, Technical Strategist; USD/JPY on Tradingview
Notes: In our last Japanese Yen Weekly Price Outlook we highlighted that USD/JPY was at risk for further losses with key support eyed lower at 104.12/46- a region defined by the 100% Fibonacci extension of the March decline and the 2019 swing low. We note to, “–be on the lookout for topside exhaustion ahead of 106.48 IF price is heading lower with a close below 104.12 ultimately needed to mark resumption.” USD/JPY briefly registered a low at 104 in September before rebounding with the rally faltering ahead of yearly channel resistance into the October open (high registered at 106.11).
A three week decline takes price back into this critical support barrier for the third time in as many months and we’re looking for inflection off this threshold. A break / weekly close below would be needed to mark resumption of the broader downtrend towards the 78.6% Fibonacci retracement of the March rally at 103.43. Weekly resistance now stands at the March channel line / October high-week close at 105.59- a close above this threshold would be needed to shift the medium-term focus back to the topside in USD/JPY with subsequent resistance objectives eyed at 106.48 and 107.62.

For a complete breakdown of Michael’s trading strategy, review his Foundations of Technical Analysis series on Building a Trading Strategy
Bottom line: A downside break of the October opening-range in USD/JPY takes price into a critical support pivot ahead of the monthly close. From a trading standpoint, a good zone to reduce short exposure / lower protective stops – be on the lookout for topside exhaustion ahead of 105.59 IF price is indeed heading lower with a close below 104.12 still needed to keep the immediate short-bias viable. Lots of event risk on tap heading into the US Presidential Elections next week - stay nimble here and look for inflection off this zone. I’ll publish and updated Japanese Yen Price Outlook once we get further clarity on the near-term USD/JPY technical trade levels.
Japanese Yen Trader Sentiment – USD/JPY Price Chart
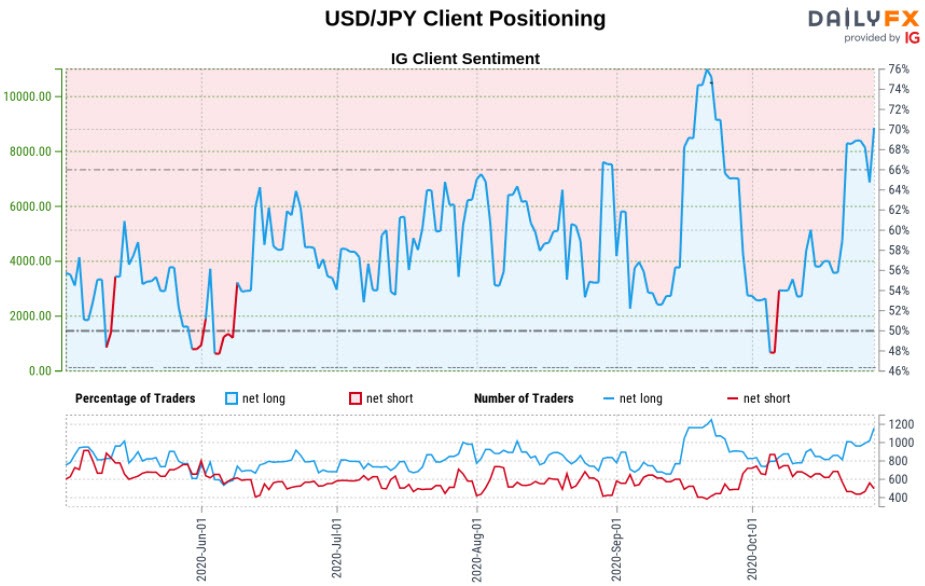
- A summary of IG Client Sentiment shows traders are net-long USD/JPY - the ratio stands at +2.40 (70.57% of traders are long) – bearish reading
- Long positions are13.04% higher than yesterday and 31.61% higher from last week
- Short positions are 20.00% lower than yesterday and 0.61% lower from last week
- We typically take a contrarian view to crowd sentiment, and the fact traders are net-long suggests USD/JPY prices may continue to fall. Traders are further net-long than yesterday and last week, and the combination of current positioning and recent changes gives us a stronger USD/JPY-bearish contrarian trading bias from a sentiment standpoint.
| Change in | Longs | Shorts | OI |
| Daily | -2% | 2% | 0% |
| Weekly | 12% | -16% | -6% |
---
Key US / Japan Data Releases
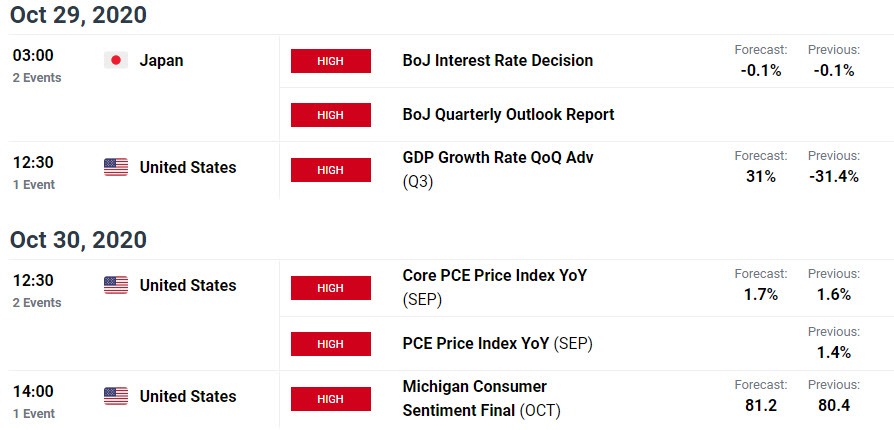
Economic Calendar - latest economic developments and upcoming event risk.
Previous Weekly Technical Charts
- Australian Dollar (AUD/USD)
- British Pound (GBP/USD)
- Gold (XAU/USD)
- Euro (EUR/USD)
- Australian Dollar (AUD/USD)
- Canadian Dollar (USD/CAD)

--- Written by Michael Boutros, Technical Currency Strategist with DailyFX
Follow Michael on Twitter @MBForex


