


Gold Price Forecast Overview:
- Gold prices have not made much progress in the days ahead of the Jackson Hole Economic Policy Symposium.
- It still holds that gold prices still have both fundamental (expansionary fiscal and monetary policies, producing negative real yields) and technical (triangle consolidation during an uptrend) tailwinds at their back.
- According to the IG Client Sentiment Index, the gold price rally is not ready to resume.

Gold Prices Coil into Triangle amid Uptrend
Gold prices have made little progress in recent days, and really over the past two weeks, as traders await the Jackson Hole Economic Policy Symposium at the end of this week. Last week’s doji candle has been met by a doji/bullish hammer (depending upon perspective), suggesting that traders are not yet ready to throw in the towel on the explosive summer rally.
Even as the gold price rally has paused, it remains the case that gold prices still have both fundamental and technical tailwinds at their back. Thanks to expansionary monetary policy and thus far underwhelming fiscal policy responses, mixed with the global economic uncertainty brought about by the coronavirus pandemic, real yields continue to fall and remain depressed.
An environment defined by depressed and/or negative real yields has historically proven bullish for precious metals. With the Federal Reserve’s Jackson Hole Economic Policy Symposium coming over the next few days, a reminder of the dour economic conditions and the needed ongoing extraordinary monetary stimulus measures may draw interest back to precious metals, in particular gold prices.
Gold Volatility Pulling Back, Weighing on Gold Prices
Gold prices have a relationship with volatility unlike other asset classes. While other asset classes like bonds and stocks don’t like increased volatility – signaling greater uncertainty around cash flows, dividends, coupon payments, etc. – gold tends to benefit during periods of higher volatility. Heightened uncertainty in financial markets due to increasing macroeconomic tensions increases the safe haven appeal of gold.
Read more: How Do Politics and Central Banks Impact FX Markets?
GVZ (Gold Volatility) Technical Analysis: Daily Price Chart (October 2008 to August 2020) (Chart 1)
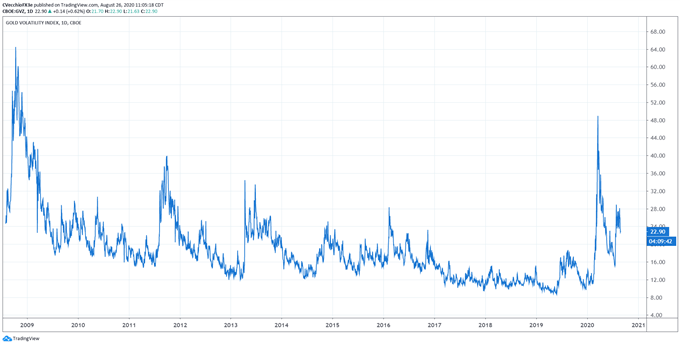
Gold volatility has started to pullback to a more significant degree, and alongside a sideways move in gold prices, there has been a deterioration in short-term correlations. Gold volatility (as measured by the Cboe’s gold volatility ETF, GVZ, which tracks the 1-month implied volatility of gold as derived from the GLD option chain) is trading at 22.90. The 5-day correlation between GVZ and gold prices is 0.35 while the 20-day correlation is 0.22; one week ago, on August 19, the 5-day correlation was 0.31 and the 20-day correlation was 0.40.
Our longstanding axiom holds: “given the current environment, falling gold volatility is not necessarily a negative development for gold prices, whereas rising gold volatility has almost always proved bullish; in the same vein, gold volatility simply trending sideways is more positive than negative for gold prices.”

Gold Price Technical Analysis: Daily Chart (August 2019 to August 2020) (Chart 2)
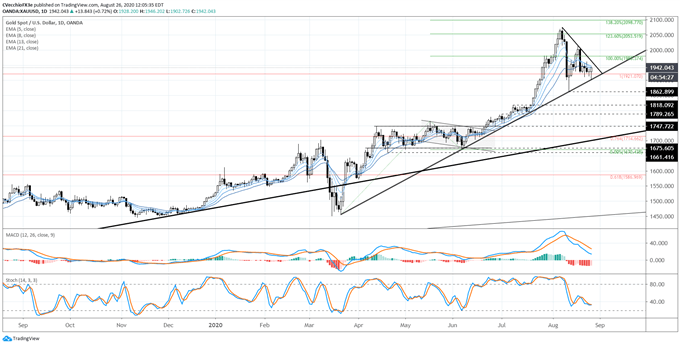
The volatility seen in gold prices throughout August may have yielded a consolidation in the form of a triangle, finding resistance from the August swing highs and support from the March, June, and August swing lows. Such an occurrence in context of the multi-month uptrend speaks to greater upside potential over the coming weeks.
It is important to note that the pullback in gold prices during August halted at two key levels: the rising trendline support from the March and June 2020 lows –the coronavirus pandemic trendline; and the former all-time high near 1921.07. The first test of support arrived as the daily candle carved out a doji; and the second test appeared as a hammer candle on the daily chart. Concurrently, these are signs that the all-time high is a significant zone of demand.
Gold Price Technical Analysis: Weekly Chart (June 2011 to August 2020) (Chart 3)
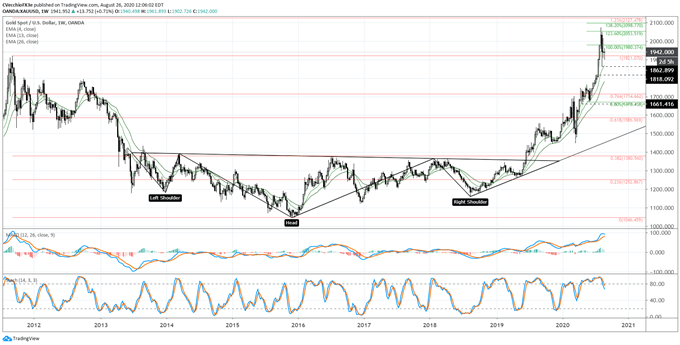
“Gold prices have completed the inverse head and shoulders pattern first identified in mid-2019. Depending upon the placement of the neckline, the final upside target was 1820.99. The long-term gold thesis is now evolving, but with the bottoming effort completed, we can now turn our attention to all-time highs at 1921.07 – and well-beyond over the coming months.” Gold prices failing through the former yearly high at 1921.07 would be a major warning sign for gold bulls. A loss of the August low at 1862.90 would be a very important development insofar as redefining the recent consolidation as a topping effort rather than a bullish continuation effort.
IG Client Sentiment Index: Gold Price Forecast (August 28, 2020) (Chart 4)
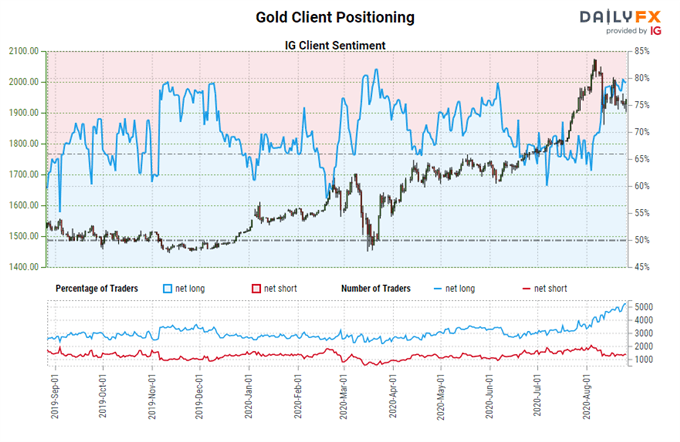
Gold: Retail trader data shows 78.53% of traders are net-long with the ratio of traders long to short at 3.66 to 1. The number of traders net-long is 2.34% lower than yesterday and 1.00% lower from last week, while the number of traders net-short is 5.08% lower than yesterday and 4.29% lower from last week.
We typically take a contrarian view to crowd sentiment, and the fact traders are net-long suggests Gold prices may continue to fall.
Traders are further net-long than yesterday and last week, and the combination of current sentiment and recent changes gives us a stronger Gold-bearish contrarian trading bias.
--- Written by Christopher Vecchio, CFA, Senior Currency Strategist


