


Impact of Monetary and Fiscal Policy on FX Markets, Key Central Bank Rate Decisions From ECB, BoC and Fed, US Dollar, Euro, Canadian Dollar Analysis – TALKING POINTS
- How do monetary and fiscal policy measures impact currency markets?
- What is the Mundell-Fleming model and why does it matter for FX traders?
- How has policy from the Fed, ECB and BOC impacted USD, EUR and CAD?
MARKETS HAVE PASSED THE POLITICAL EVENT HORIZON
For foreign exchange (“forex” or “FX”) traders, the constant background noise that politics represents is an inescapable blackhole. Traditional media drowns in punditry, while social media drowns in puns. It doesn’t matter what asset class you’re trading either.In recent years, even a single tweet from a politician has had the capacity to move not only currencies but also bonds,commodities, and equities.
In an increasingly fractious landscape, traders need a framework by which to interpret information and understand political developments as they happen. After all, politics can become policy after enough time and effort. To this end, FX traders need a way to interpret information and political developments in the context of how fiscal policy could change and how that might impact their portfolios.
Market participants need to pay attention to more than just fiscal policy, however. With central bank activity having gained considerable traction during the Great Recession and thereafter, monetary policylooks to be a powerful lasting influence on markets. Therefore, FX traders need a viable framework to analyze both fiscal and monetary policy in tandem.
ECONOMISTS HAVE A SOLUTION BEYOND THE IS-LM MODEL
Fortunately, one such framework exists: IS-LM-BP model, or what’s known colloquially as the Mundell-Fleming model. Through this framework, FX traders can analyze how directional changes in fiscal policy (e.g. changes in taxes or government spending) and monetary policy (e.g. changes in interest rates) interact to produce various market outcomes.
Before we delve into the framework, a bit of background history on the Mundell-Fleming model.
Mundell-Fleming is an extension of IS-LM, which itself is an equilibrium model used by economists to look at the relationship between interest rates (the real interest rate, “i” on the vertical axis of the chart below) and economic growth (real gross domestic product, “Y” on the horizontal axis).
IS-LM Curve – Interest Rates and Economic Growth (Chart 1)
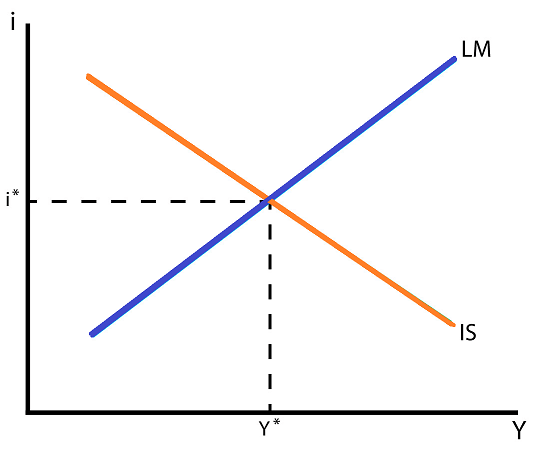
Without going too far down the academic rabbit hole, there are two takeaways of the IS-LM model that carryover into understanding the Mundell-Fleming model.
First, that the downward sloping IS curve demonstrates that as the level of interest rates fall, the level of economic activity rises. This is intuitive: the more readily credit is available, the more economic activity will flourish.
Second, the upward sloping LM curve demonstrates that as economic activity rises, the level of interest rates rise too. This is also intuitive: stronger economic activity provokes inflation and higher bond yields in response.
THE IS-LM MODEL IS INAPPROPRIATE FOR MODERN ECONOMIES
Why is the IS-LM model insufficient for traders? The IS-LM model is a foundational concept that ultimately leads to the classic AS-AD supply-demand model. But the IS-LM model is applicable for self-sufficient and/or closed economies; such a framework is not appropriate for a globalized world where open economies co-dependent on one another are the norm. We need to move beyond for a more complete framework.

THE MUNDELL-FLEMING MODEL WORKS BETTER FOR OPEN ECONOMIES
In the early-1960s, economists Robert Mundell and J. Marcus Fleming each produced improvements on the incomplete IS-LM model. Developed independently from one another but eventually synthesized into one unified idea, the IS-LM-BP model incorporates capital flow into the equation.
There are two different capital flow constraints within the IS-LM-BP, or Mundell-Fleming model. Countries either seehigh or lowcapital mobility. Depending upon which it is, different policy mixes lead to divergent reactions in the markets.
As a rule of thumb, developed countries and their currencies (e.g. the US, UK, Eurozone, Japan, etc.) have high capital mobility. On the other hand, emerging markets and their currencies (e.g. Brazil, China, South Africa, Turkey, etc.) have low capital mobility.
For the sake of this discussion, we will look at the Mundell-Fleming model through the lens of high capital mobility economies only, and as a result, attempt to set forth a framework to understand how different fiscal and monetary policy mixes impact the major currencies like the US Dollar, Euro, British Pound and Japanese Yen.
In a follow-up report, we will show the implications of the Mundell-Fleming model through the lens of low capital mobility economies and the resulting impact of policy changes for emerging market currencies.
DIFFERENT POLICY MIXES LEAD TO DIVERGENT REACTIONS IN MARKETS
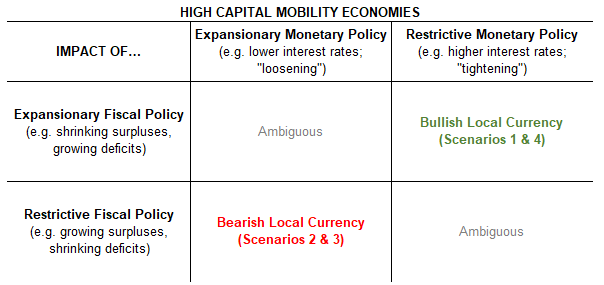
For high capital mobility economies, there are effectively four different sets of policy shifts that can provoke a reaction in FX markets. They are:
- Scenario 1: Fiscal policy is already expansionary + monetary policy becomes more restrictive (“tightening”) = Bullish for the local currency
- Scenario 2: Fiscal policy is already restrictive + monetary policy becomes more expansionary (“loosening”) = Bearish for the local currency
- Scenario 3: Monetary policy already expansionary (“loosening”) + fiscal policy becomes more restrictive = Bearish for the local currency
- Scenario 4: Monetary policy is already restrictive (“tightening”) + fiscal policy becomes more expansionary = Bullish for the local currency
It is important to note that for an economy like the United States and a currency like the US Dollar, whenever fiscal policy and monetary policy start trending in the same direction, there is often an ambiguous impact on the currency.
In other words, when viewed through the framework of the Mundell-Fleming model, when both fiscal and monetary policy are expansionary, or when both fiscal and monetary policy are restrictive, that currency is unlikely to see a significant directional move in the nearfuture.
Instead, armed with this insight, traders expecting a period of trendless oscillation in a given currency may be encouraged to set aside momentum- and trend-based strategies to adopt an approach optimized for range-bound conditions.
Mundell-Fleming Model Framework for High Capital Mobility Economies (Table 1)
Here are four examples in in the past decade from various high capital mobility economies from around the world that illustrate how using the Mundell-Fleming model as a framework for understanding politics and central banks would have given a trader an analytical edge.
Scenario 1 - FISCAL POLICY LOOSE; MONETARY POLICY BECOMES TIGHTER
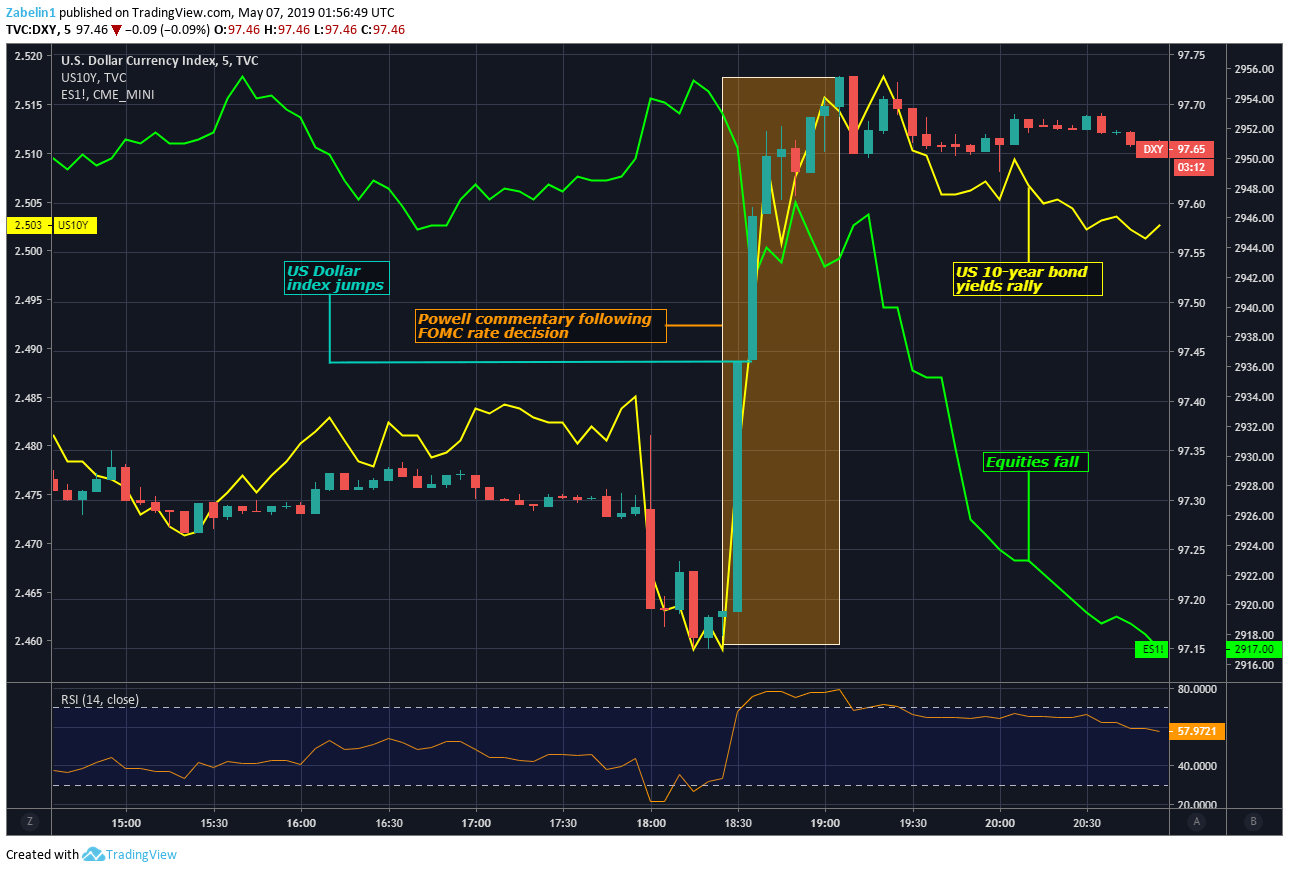
On May 2, 2019 – following the FOMC decision to hold rates at the 2.25-2.50 range – Fed Chairman Jerome Powell said that the relatively soft inflationary pressure in the economy was “transitory”. The implication behind this was that while price growth was below what central bank officials were hoping for, it would soon accelerate.
The implicit message was then a reduced probability of a cut in the future, given that the fundamental outlook was judged to be solid and the overall trajectory of US economic activity seen to be on a healthy path. The neutral tone struck by the Fed was comparatively less dovish than what markets had anticipated. This might then explain why overnight index swaps for a Fed rate cut by the end of the year fell from 67.2 percent down to 50.9 percent after Powell’s comments.
Meanwhile, the Congressional Budget Office (CBO) is forecasted an increase in the deficit over the next three years, overlapping the central bank’s tightening cycle. This also came against the backdrop of speculation about a bipartisan fiscal stimulus plan. In late April, key policymakers announced plans for a US$2 trillion infrastructure program.

The combination of expansionary fiscal policy and monetary tightening made the case for a bullish outlook for the US Dollar. The fiscal package was expected create jobs and boost inflation, thereby nudging the Fed to raise rates. As it happened, the Greenback added 6.2 percent against an average of its major currency counterparts over the subsequent four months.
Scenario 1: DXY, 10-Year Bond Yields Rise, S&P500 Futures Fall (Chart 2)
Scenario 2 - FISCAL POLICY TIGHT; MONETARY POLICY BECOMES LOOSER
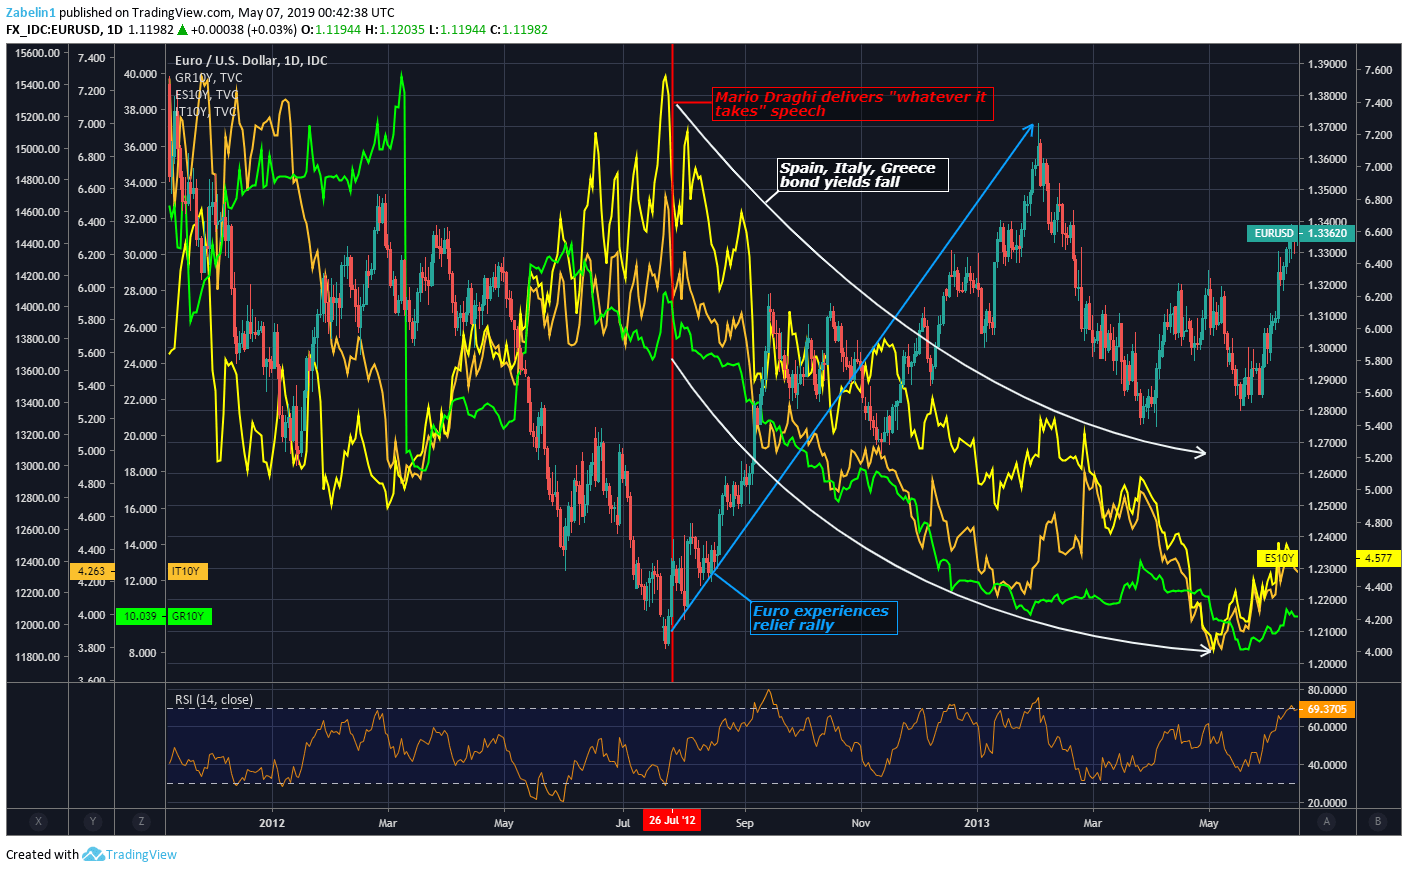
Theglobal financial crisis in 2008 and the Great Recession that followed rippled out worldwide and destabilized Mediterranean economies. This stoked worries about a region-wide sovereign debt crisis as bond yields in Italy, Spain and Greece climbed to alarming levels.
Investors began to lose confidence in the ability of these governments to service their debt and demanded a higher yield for incurring what appeared to be a higher risk of default. The Euro was in pain amid the chaos and suffered as doubtsemerged about its very existence in the event that the crisis would force the unprecedented departure of a member state from the Eurozone.
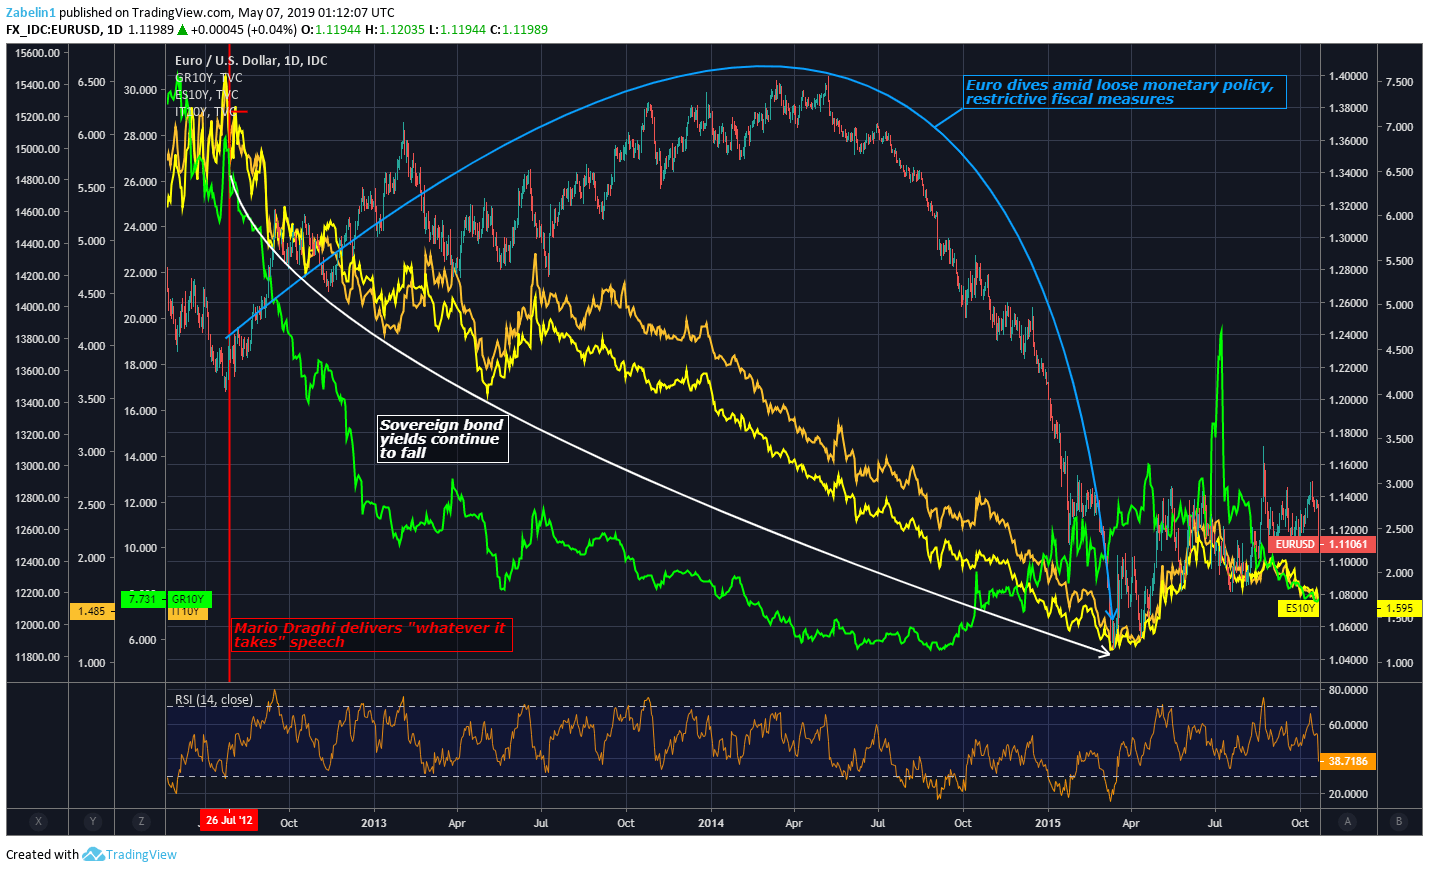
In what is considered to be one of the most famous moments in financial history, European Central Bank (ECB) President Mario Draghi delivered a speech in London on July 26, 2012 which many would come to see as the pivotal moment that saved the single currency. He said that the ECB is “ready to do whatever it takes to preserve the Euro. And believe me,” he added,“it will be enough.” This speech calmed European bond markets and helped bring yields back down.

The ECB alsocreated a bond-buying program called OMT (for “Outright Monetary Transactions”). It was aimed at reducing stress in sovereign debt markets, offering relief to distressed Eurozone governments. While OMT was never used, its mere availability helped becalm jittery investors.At the same time, many of the troubled Euro area states adopted austerity measures to stabilize government finances.
While the Euro initially rose as worries about its collapse receded, the European currency would depreciate substantially against the US Dollar over the course of the following three years. By March 2015, it had lost over 13 percent of its value. When examining the monetary and fiscal set up, it becomes quite clear why.
Scenario 2: Euro Sighs Relief – Sovereign Bond Yields Fall as Insolvency Fears are Quelled (Chart 3)
Austerity measures in many Eurozone countries limited their governments’ ability to provide fiscal stimulus that might have helped create jobs and boost inflation. At the same time, the central bank was easing policy as a way to alleviate the crisis. Consequently, this combination pressured the Euro lower against most of its major counterparts.
Scenario 2: Euro, Sovereign Bond Yields Fall (Chart 4)
Scenario 3 - MONETARY POLICY LOOSE; FISCAL POLICY BECOMES TIGHTER
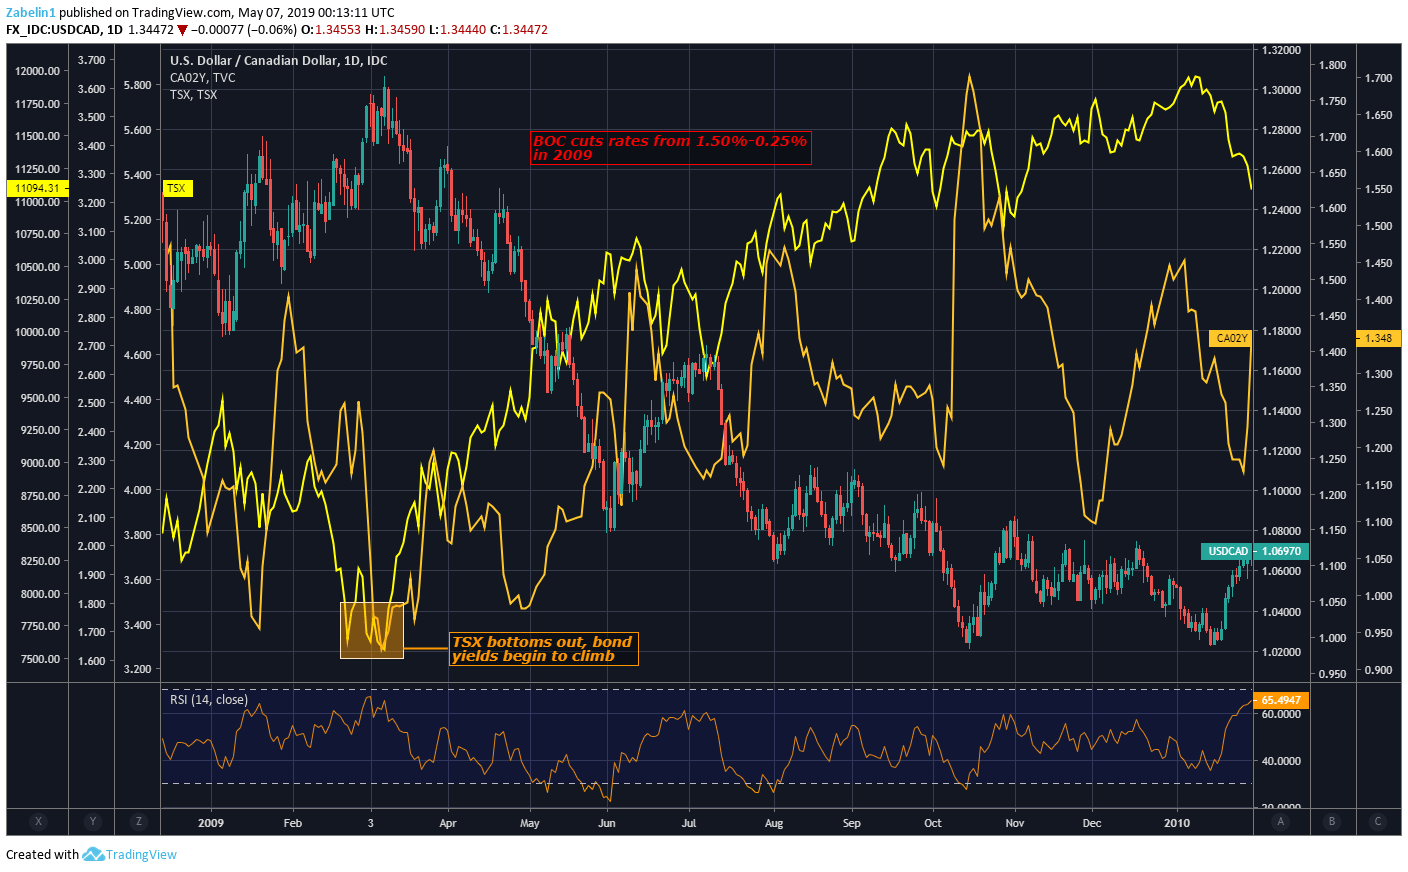
At the early stages of the Great Recession, the Bank of Canada (BOC) cut its benchmark interest rate from 1.50 to 0.25 percent as a way to ease credit conditions, restore confidence and revive economic growth. Counter-intuitively, the yield on 10-year Canadian government bonds began to rise. This rally came right around the same time as Canada’s benchmark TSX stock index established a bottom.
Scenario 3: USD/CAD, TSX, Canadian 2-Year Bond Yields (Chart 5)
The subsequent restoration of confidence and recovery in share prices was reflected investors’ shifting preference for riskier, higher-returning investments (like stocks)from comparatively safer alternative (like bonds). This reallocation of capital sent yields higher despite the central bank’s monetary easing. The BOC then began to raise rates anew and brought them up to 1.00 percent, where they remained for the subsequent five years.
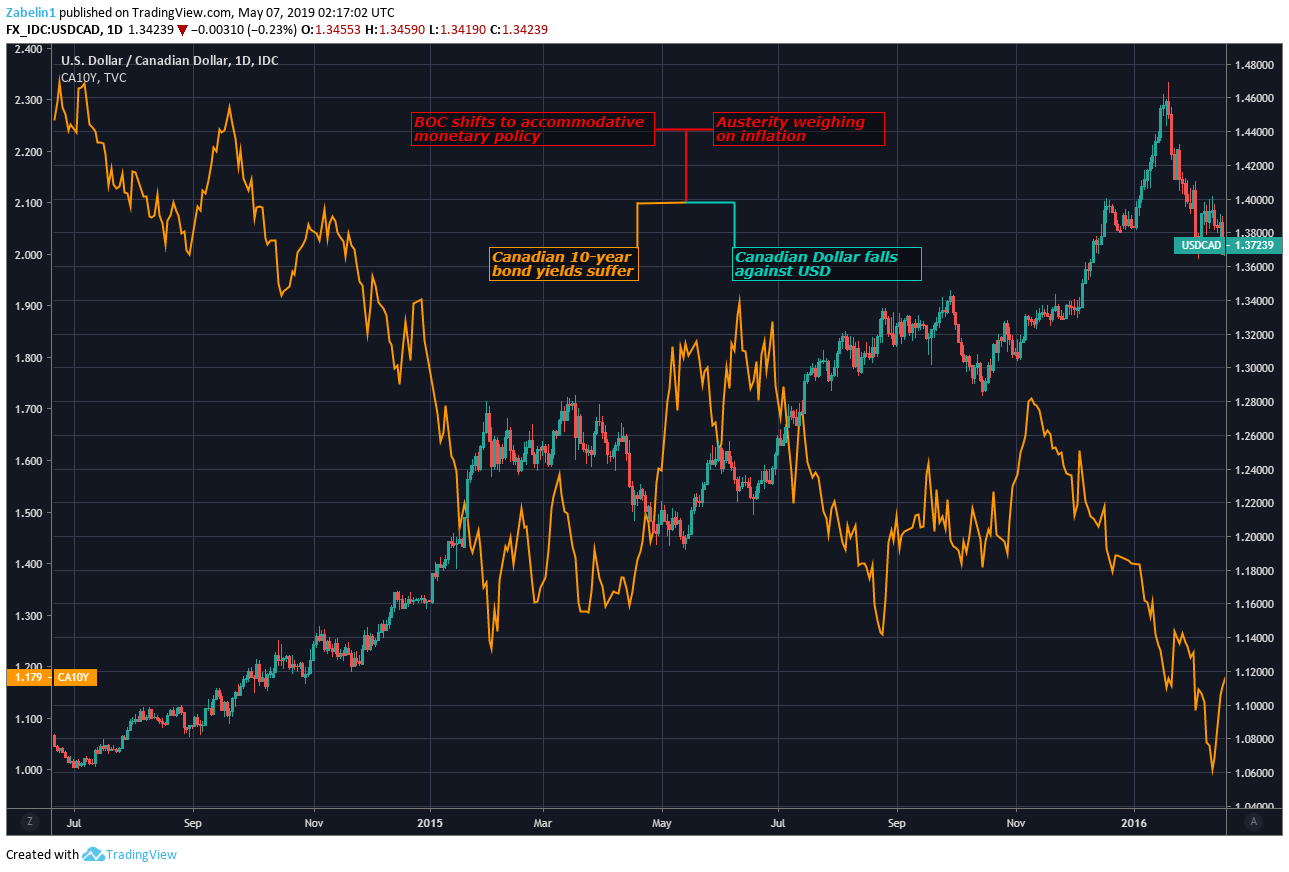
During this time, Prime Minister Stephen Harper implemented austerity measures to stabilize the government’s finances amid the global financial crisis. The central bank then reversed course and cut rates back to 0.50 percent by July 2015. Both CAD and local bond yields suffered as monetary policy was loosened while the capacity for fiscal policy support was constrained. As it happens, cutting back government spending at this difficult time ended up costing Mr Harper his job. Justin Trudeau replaced him as Prime Minister following a victory in the 2015 general election.
Scenario 3: USD/CAD, Canada 2-Year Bond Yields (Chart 6)
Scenario 4 - MONETARY POLICY TIGHT; FISCAL POLICY BECOMES LOOSER
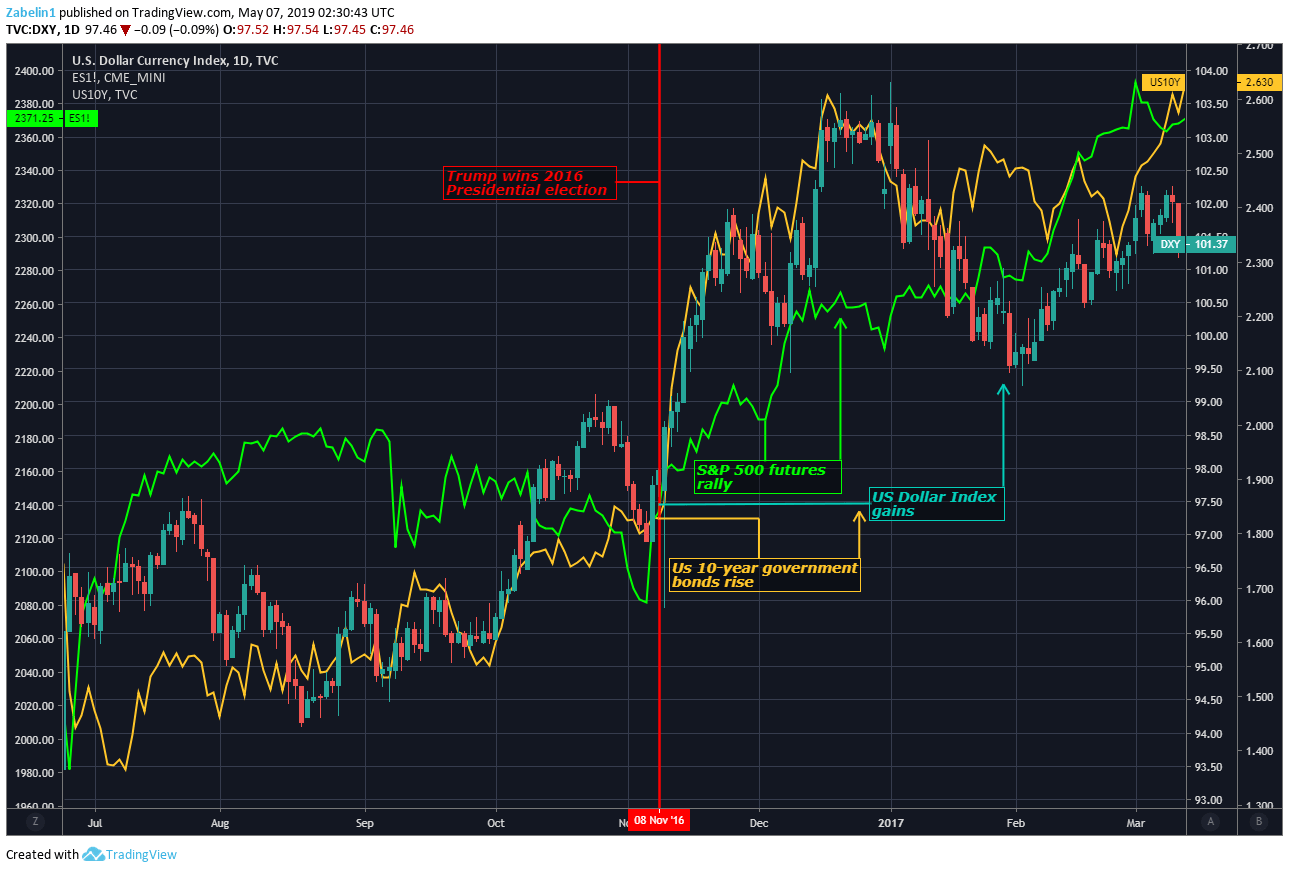
After Donald Trump was proclaimed the victor in the 2016 USpresidential election, the political landscape and economic backdrop favored a bullish outlook for the US Dollar. With the the Oval Office and both houses of Congress thus controlled by the Republican Party, the markets appeared to conclude that scope for political volatility had was substantially reduced.
This made the market-friendly fiscal measures proposed by candidate Trump during the electionappear more likely to be implemented. These included tax cuts, deregulation and infrastructure building. Investors appeared to overlook threats to launch trade wars against top trading partners such as China and the Eurozone, at least for the time. On the monetary side, central bank officials raised rates at the tail end of 2016 and were looking to hike again by at least 75 basis points through 2017.
With scope for fiscal expansion and monetary tightening in sight, the US Dollar rallied alongside local bond yields and equities. This came as corporate earnings expectations strengthened alongside the outlook for broader economic performance, which likewise stoked best on firmer inflation and thereby on a hawkish response from the central bank.
Scenario 4) US Dollar Index (DXY), S&P 500 Futures, 10-Year Bond Yields (Chart 7)
LIMITATIONS OF THE MUNDELL-FLEMING MODEL
For many years, the IS-LM-BP or Mundell-Fleming model was a way to measure the impact of changes in policy for small open economies. In turn, many economists suggest that economies with significant enough scale may not adhere to the “rules” that “normal” economies have to contend with, and as a result, the IS-LM model was deemed preferable.
But in the past decade, new research has showed that the framework presented in IS-LM-BP in fact captures the state of the contemporary globalized economy better than the IS-LM model alone. Needless to say, opinions on the subject abound across the spectrum of economists.
Ultimately, there is no ‘Holy Grail’ analytical framework that will yield the proper insight every single time, regardless of the political context or the status of the monetary system. There may be times that events produce market reactions that can’t be readily understood or explained.
And yet, not having a framework for how to interpret how politics and central banks are moving FX markets would be irresponsible. Using the Mundell-Fleming model as a guide may help traders filter out the noise of the day-to-day news cycle, helping them better understand and practically react to information shaping FX market price trends.
--- Written by Christopher Vecchio, CFA, Senior Currency Strategist and Dimitri Zabelin, Currency Analyst


