


Gold Price Talking Points:
- The gold price rally in June may mark the continuation of a major bottoming effort that began in 2017, after breaking the multi-year descending trendline from the 2011 high. The multi-year inverse head and shoulders pattern points to gold price targets between 1685.67 and 1820.99.
- Gold volatility, as measured by the Cboe’s ETF, GVZ (which tracks the 1-month implied volatility of gold as derived from the GLD ETF option chain) is at its highest level since December 2016. The recent correlation between the spot gold price and gold volatility is nearly a perfect positive correlation.
- Retail traders’ holdings are beginning to warn that positioning may weigh on the gold price rally soon.
Looking for longer-term forecasts on Gold and Silver prices? Check out the DailyFX Trading Guides.
The gold price rally in June has led to one of the strongest performances (thus far) by bullion in recent memory. In fact, with gold prices up by 8.73% in June 2019 at the time of writing, you have to go back to June 2016 (8.74%) in order to find another performance as strong as the one we’ve witnessed so far this month.
There are numerous factors driving the gold price rally, but at the root of them all lies the US-China trade war. The prospect of the world’s two largest economies engaging in a tit-for-tat tariff standoff has already started to cool global growth, and now Federal Reserve policymakers, led by Fed Chair Jerome Powell, are signaling to financial markets that they are ready to cut interest rates if necessary. Indeed, per the June Fed meeting, eight FOMC policymakers foresee lower interest rates by the end of 2019.
Gold Price Rally Being Driven by Fall in US 10-Year Treasury Yield, US Dollar
With FOMC policymakers’ forward guidance pointing to lower interest rates in the future, US Treasury yields have been steadily eroding in recent weeks, with the US 10-year Treasury yield dropping below 2.000% for the first time since November 2016 – a precipitous decline of more than 100-bps from where it stood in November 2018.
As has been the case for several weeks now, the ongoing decline in US Treasury yields amid speculation that a Fed rate cut cycle is about to begin has been fundamentally bullish for gold prices. With inflation relatively stable around the Fed’s medium-term target of 2%, the drop in nominal US Treasury yields has created an environment where real US yields are falling, undermining the US Dollar in the process.
Historically, falling real US yields and a weaker US Dollar have been paramount to periods when gold prices have rallied. In recent weeks, these relationships have proven valid: the 20-day correlation between gold prices (via XAU/USD) and the US 10-year Treasury yield is -0.82 (i.e. as yields fall gold rises); and the 20-day correlation between gold prices (via XAU/USD) and the US Dollar (via the DXY Index) is -0.76 (i.e. as the US Dollar falls gold rises).
Falling US Yields and Weak US Dollar Symptomatic of the US-China Trade War
Recall the June Fed meeting and the press conference held by Fed Chair Jerome Powell. The elephant in the room during the press conference was the impact of the US-China trade war on monetary policy. It stands to reason that as a fiscal policy expedition, the US-China trade war may not be able to be fully offset by the Fed cutting its main interest rate. Even that being the case, the FOMC stands ready to act should the economy (via tightening financial conditions) necessitate a series of interest rate cuts over the coming months.
If the most likely scenario for the Fed is to cut rates two times in 2019, the second most likely scenario may be that there are no rate moves at all (should a US-China trade deal emerge). In turn, this disparity in potential outcomes is leading to an environment marked by increased volatility.
Gold Volatility Has Been the Predominant Factor for Gold Prices - More Than Others
While the gold price rally has been aided by falling US Treasury yields and the weak US Dollar, these are not the root causes of the recent market environment, but merely symptoms of the US-China trade war and its impact on Fed policy. The key theme here is “uncertainty.” Uncertainty in financial markets translates to volatility.
This uncertainty over the Fed’s next move has been bullish for gold prices via gold volatility. While other asset classes don’t like increased volatility (signaling greater uncertainty around cash flows, dividends, coupon payments, etc.), precious metals tend to benefit from periods of higher volatility as uncertainty increases the appeal of gold’s and silver’s safe haven appeal.
GVZ (Gold Volatility) Technical Analysis: Daily Price Chart (September 2017 to June 2019) (Chart 1)
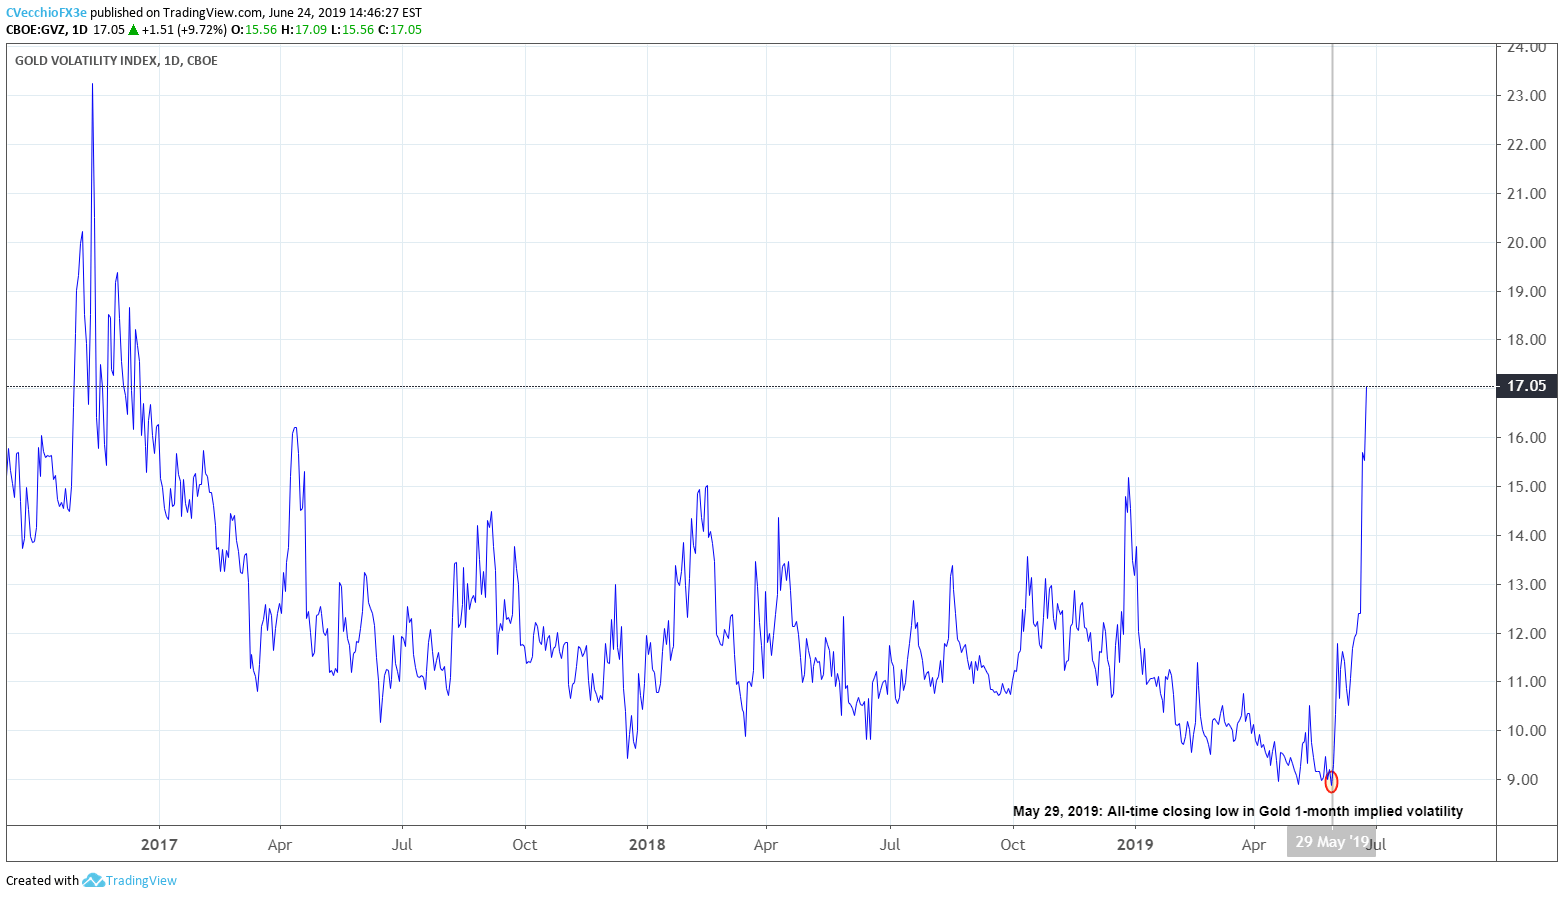
Following the June Fed meeting, gold volatility (as measured by the Cboe’s gold volatility ETF, GVZ, which tracks the 1-month implied volatility of gold as derived from the GLD option chain) is on pace to close at a fresh monthly high, its highest close of 2019, and its highest close since December 16, 2016. As we’ve previously noted, “the breakout in gold volatility underpins the breakout in gold prices.” This rings truer than ever at present time, as both the 5-day and 20-day correlations between gold prices (XAU/USD) and gold volatility (GVZ) is a near-perfect 0.97.
G20 Summit Matters Significantly for Gold Prices
It would seem then that it is a straight line for gold prices to higher levels: if uncertainty around Fed policy remains thanks to the US-China trade war, gold volatility will remain elevated. The G20 summit in Osaka, Japan this coming weekend offers a critical litmus test for the recent gold price rally: a deal could scuttle even the best laid technical patterns for higher prices.
Nevertheless, at present time, it appears that traders are anticipating that the G20 summit this weekend will yield little. Technical analysis studies show that gold prices may be gearing up for a significant long-term rally over the coming months; traders are not dissuaded by the short-term threat of a US-China trade deal coming together at the G20 summit in Osaka, Japan.
Gold Price Technical Analysis: Weekly Chart (August 2011 to June 2019) (Chart 2)

The gold price rally in June may mark the continuation of a major bottoming effort that began in 2017, after breaking the multi-year descending trendline from the 2011 high. The turn lower at the end of 2018 may be a right shoulder in a multi-year inverse head and shoulders pattern, with the head forming at the November 2015 low at 1046.23.
Ultimately, the placement of the neckline determines the final upside targets in a potential long-term gold price rally: conservatively, drawing the neckline breakout against the January 2018 high at 1365.95; aggressively, drawing the neckline breakout against the August 2013 high at 1433.61 calls for a final target at 1820.99. The multi-year inverse head and shoulders pattern would remain valid so long as gold prices hold above the most recent neckline touch at 1365.95.
Gold Price Technical Analysis: Daily Chart (July 2018 to June 2019) (Chart 3)

Before traders get ahead of themselves on a potential multi-year bottoming effort by gold prices, the near-term effort may still have some room to run higher. The 100% extension of the gold price rally from the August 2018 low, February 2019 high, and May 2019 low comes in at 1452.72. Only if gold prices move below the daily 8-EMA, which has held up as support on a closing basis every session since the bullish outside engulfing bar on May 30, would the near-term bullish outlook for gold prices become invalid.
Gold Price Rally Fits Definition of Overbought
Despite all of the exuberance over gold prices – and there is a good deal of technical evidence to support long-term bullish forecasts – traders should remain cautious. Since the gold price bottom developed in Q3’19, there have been five instances in which gold prices were more than 2% above their daily 21-EMA (i.e. overbought). In the previous five instances, gold prices averaged a 1-week return of -0.55%. Gold prices the past three days have fit this definition of overbought again. The risk for a near-term gold price blow off move to the topside, before a round of profit taking, has increased.
IG Client Sentiment Index: Spot Gold Price Forecast (June 24, 2019) (Chart 4)

Spot gold price: Retail trader data shows 60.5% of traders are net-long with the ratio of traders long to short at 1.53 to 1. The number of traders net-long is 10.6% higher than yesterday and 26.8% higher from last week, while the number of traders net-short is 10.0% higher than yesterday and 6.5% higher from last week.
We typically take a contrarian view to crowd sentiment, and the fact traders are net-long suggests spot gold prices may continue to fall. Traders are further net-long than yesterday and last week, and the combination of current sentiment and recent changes gives us a stronger spot gold price-bearish contrarian trading bias.
FX TRADING RESOURCES
Whether you are a new or experienced trader, DailyFX has multiple resources available to help you: an indicator for monitoring trader sentiment; quarterly trading forecasts; analytical and educational webinars held daily; trading guides to help you improve trading performance, and even one for those who are new to FX trading.
--- Written by Christopher Vecchio, CFA, Senior Currency Strategist
To contact Christopher Vecchio, e-mail at cvecchio@dailyfx.com
Follow him on Twitter at @CVecchioFX
View our long-term forecasts with the DailyFX Trading Guides


