


Gold Price Forecast Overview:
- Gold futures climbed past $1800/oz today for the first time since 2011, a sign that the tailwind behind the spot gold price market remains strong.
- It still holds that, given the outlook for real yields and gold price’s historical relationship with volatility, the fundamental bias remains bullish.
- According to the IG Client Sentiment Index, the gold price rally looks strong.

Gold Futures Hits $1800 for First Time Since 2011
Gold prices continue to rally, bolstered by one of the more bullish fundamental environments in this strategist’s memory. The fact remains that falling real yields, thanks to expansionary monetary policy, coupled with the global economic uncertainty brought about by the coronavirus pandemic, has provoked traders to diversify into precious metals. You can read more about these themes in-depth in the prior gold price forecast (or any of them since early-April).
Gold Volatility Steady, Remains Supportive
Absent the recent rally in gold prices has been a commensurate rise in gold volatility. This is not necessarily a negative development, however. As we’ve noted previously, “given the current environment, falling gold volatility is not necessarily a negative development for gold prices, whereas rising gold volatility has almost always proved bullish.” In the same vein, gold volatility simply trending sideways is more positive than negative for gold prices.
Gold prices have a relationship with volatility unlike other asset classes, even including precious metals like silver which have more significant economic uses. While other asset classes like bonds and stocks don’t like increased volatility – signaling greater uncertainty around cash flows, dividends, coupon payments, etc. – gold tends to benefit during periods of higher volatility.
Heightened uncertainty in financial markets due to increasing macroeconomic tensions increases the safe haven appeal of gold. Now that there are plenty of signs that no V-shaped economic recovery will occur, and the Federal Reserve intent on keeping the liquidity spigot open for the foreseeable future, the winds of an inflationary US economic environment are blowing through financial markets.
Read more: How Do Politics and Central Banks Impact FX Markets?
GVZ (Gold Volatility) Technical Analysis: Daily Price Chart (October 2008 to June 2020) (Chart 1)

Gold volatility (as measured by the Cboe’s gold volatility ETF, GVZ, which tracks the 1-month implied volatility of gold as derived from the GLD option chain) is trading at 19.82, still less than 25% of the absolute high set in mid-March near 85.50. It’s worth noting that gold volatility hasn’t traded higher than 23.04 in six weeks.
In our last update on June 25 it was noted that “developments have and should cater to higher gold prices.” Now, after a period where gold prices have rallied higher and gold volatility has moved sideways, the 5-day correlation between GVZ and gold prices is -0.12 while the 20-day correlation is 0.43; one week ago, on June 23, the 5-day correlation was 0.83 and the 20-day correlation was 0.39; and four weeks ago, on June 2, the 5-day correlation was 0.80 and the 20-day correlation was -0.39.{{GUIDE|TOST}}
Gold Price Technical Analysis: Daily Chart (June 2019 to June 2020) (Chart 2)
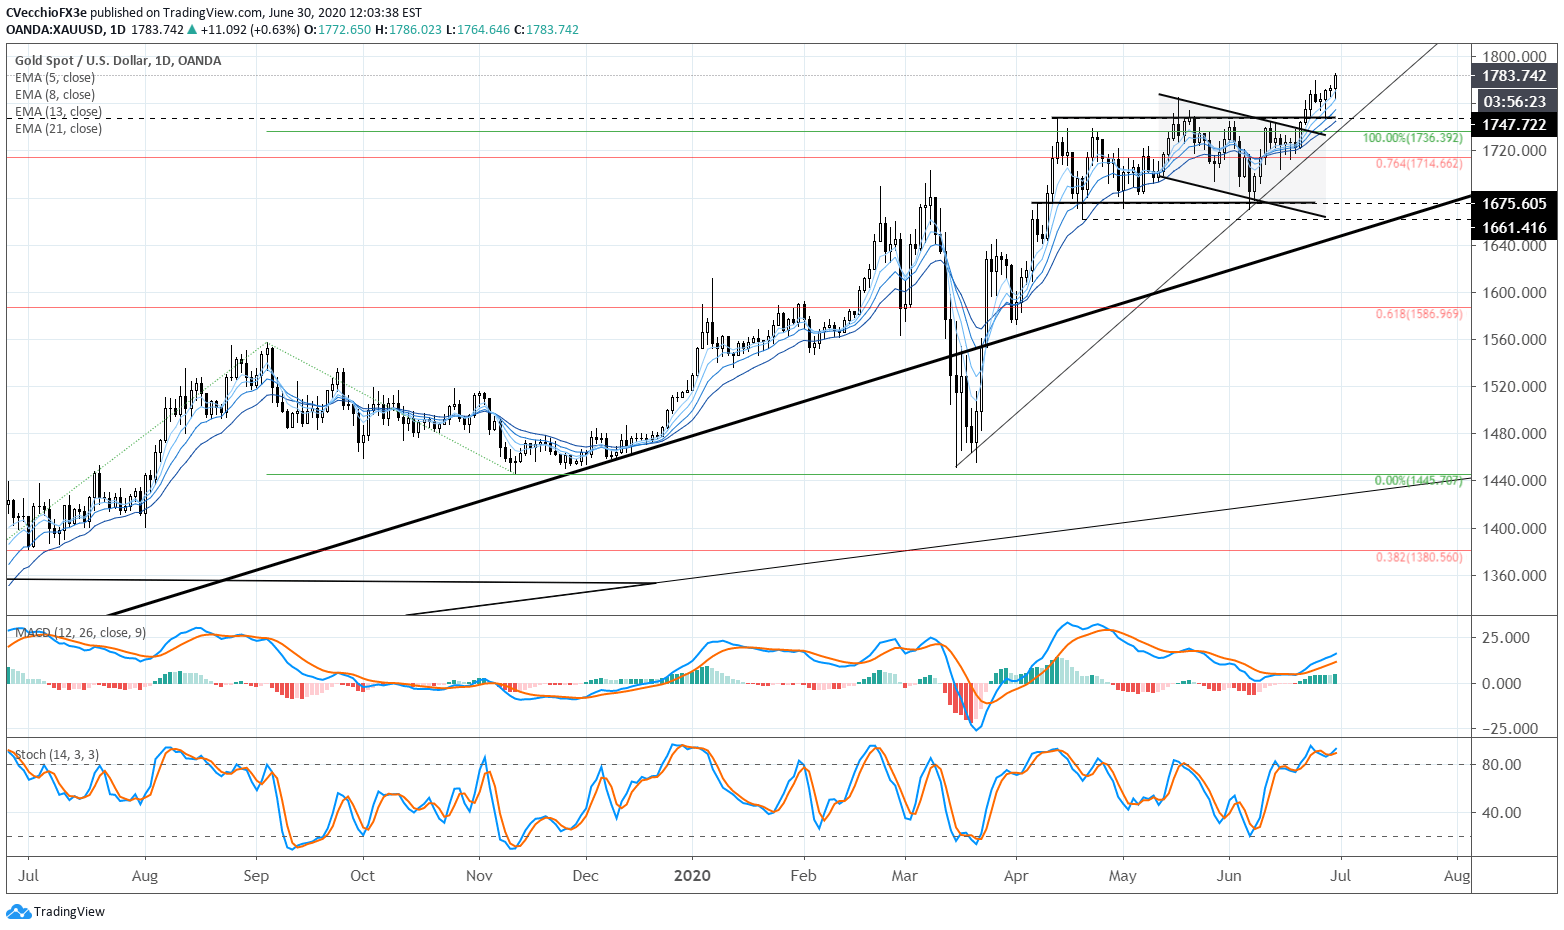
Gold prices were able to reach a fresh yearly high today, following gold futures to the topside, which touched their highest level since 2011 in clearing 1800. The spot gold market moved as high as 1782.02. The developments are in-line with expectations, insofar as we’ve been tracking the bullish breakout from the sideways range carved out between the April 14/2020 high at 1747.72 and the April 21 swing low at 1661.42; ahead of the breakout that “given that gold prices rallied into this consolidation, the market retains an upside bias.”
The measured move, derived from the high/low range between 1675 and 1748, calls for a move towards 1821, now that resistance is broken. Support comes in at the daily 5-EMA, which gold prices have not closed below since breaking out on June 24.
Gold Price Technical Analysis: Weekly Chart – Inverse Head and Shoulders Pattern (June 2011 to June 2020) (Chart 3)
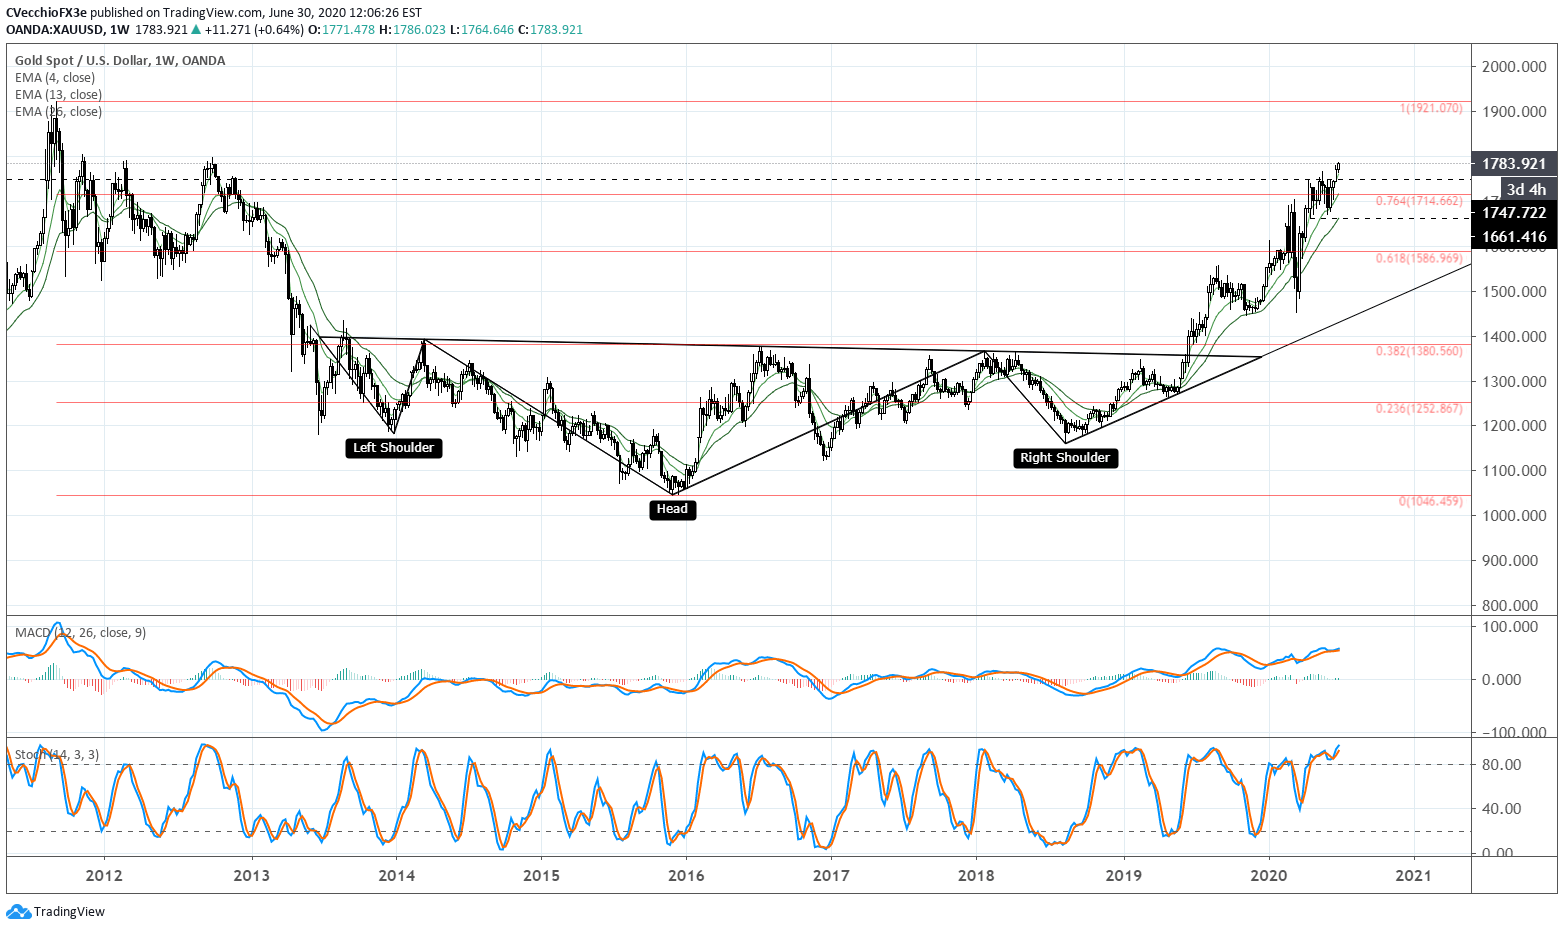
Gold prices have made significant progress within the confines of the multi-year inverse head & shoulders pattern, achieving their highest level since November 2012 earlier this week. It thus still holds that the rally into and through the 76.4% retracement (1714.66) must be viewed in context of the longer-term technical picture: the gold price inverse head and shoulders pattern that was triggered in mid-2019 is still valid and guiding gold price action.
Depending upon the placement of the neckline, the final upside targets in a potential long-term gold price rally, if drawing the neckline breakout against the August 2013 high at 1433.61, calls for a final target at 1820.99. This dovetails neatly with the measured move on the daily timeframe looking for gold prices to rally into 1834.02.
IG Client Sentiment Index: Gold Price Forecast (June 30, 2020) (Chart 4)
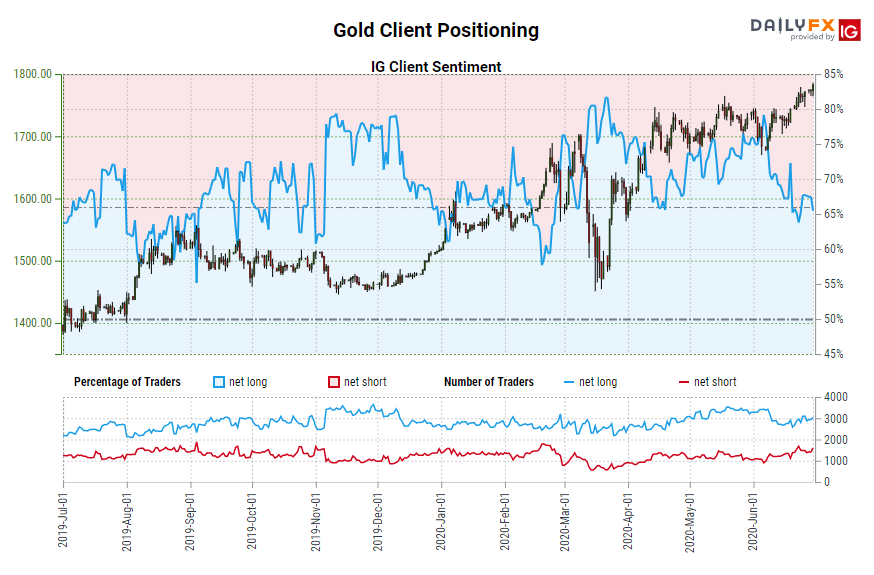
Gold: Retail trader data shows 65.30% of traders are net-long with the ratio of traders long to short at 1.88 to 1. The number of traders net-long is 0.19% lower than yesterday and 3.60% higher from last week, while the number of traders net-short is 6.03% higher than yesterday and 4.74% higher from last week.
We typically take a contrarian view to crowd sentiment, and the fact traders are net-long suggests Gold prices may continue to fall.
Yet traders are less net-long than yesterday and compared with last week. Recent changes in sentiment warn that the current Gold price trend may soon reverse higher despite the fact traders remain net-long.

--- Written by Christopher Vecchio, CFA, Senior Currency Strategist


