


Gold Price Forecast Overview:
- Gold prices continue to consolidate below their 2020 highs, but a further pullback in volatility is making life difficult for bulls.
- The drop in gold volatility back to its coronavirus pandemic lows set on March 16 is not ideal, but gold’s price level is materially higher than the last time gold volatility was this low.
- According to the IG Client Sentiment Index, traders have reduced their net-long gold positioning and the outlook remains neutral.

Gold Prices Trade Sideways into May
Gold prices wrapped up a very strong month of April, gaining 6.94%, its best performance since August 2019 (7.63%). But those gains came in the first half of the month, when gold prices hit a fresh 2020 high and their highest level in almost seven years on April 14, rising to 1747.42. In the ensuing two-plus weeks, gold prices have been on a steady burn lower.
Yet a look around global markets, even in consideration of the lower participations rates due to bank holidays around International Workers’ Day (May Day), suggests that risk appetite is not exactly in great shape, leaving open the possibility that gold prices may be looking to rise again soon. Gains by the Japanese Yen, more downside in US Treasury yields, and losses by US equity markets all conjure a scenario where gold’s appeal as a safe haven may soon come into focus.
Gold Volatility Pulls Back, Undercuts Gold Price Potential
Gold prices have a relationship with volatility unlike other asset classes, even including precious metals like silver which have economic uses. While other asset classes like bonds and stocks don’t like increased volatility – signaling greater uncertainty around cash flows, dividends, coupon payments, etc. – gold tends to benefit during periods of higher volatility. Heightened uncertainty in financial markets due to increasing macroeconomic tensions increases the safe haven appeal of gold.
Read more: How Do Politics and Central Banks Impact FX Markets?
GVZ (Gold Volatility) Technical Analysis: Daily Price Chart (October 2008 to May 2020) (Chart 1)
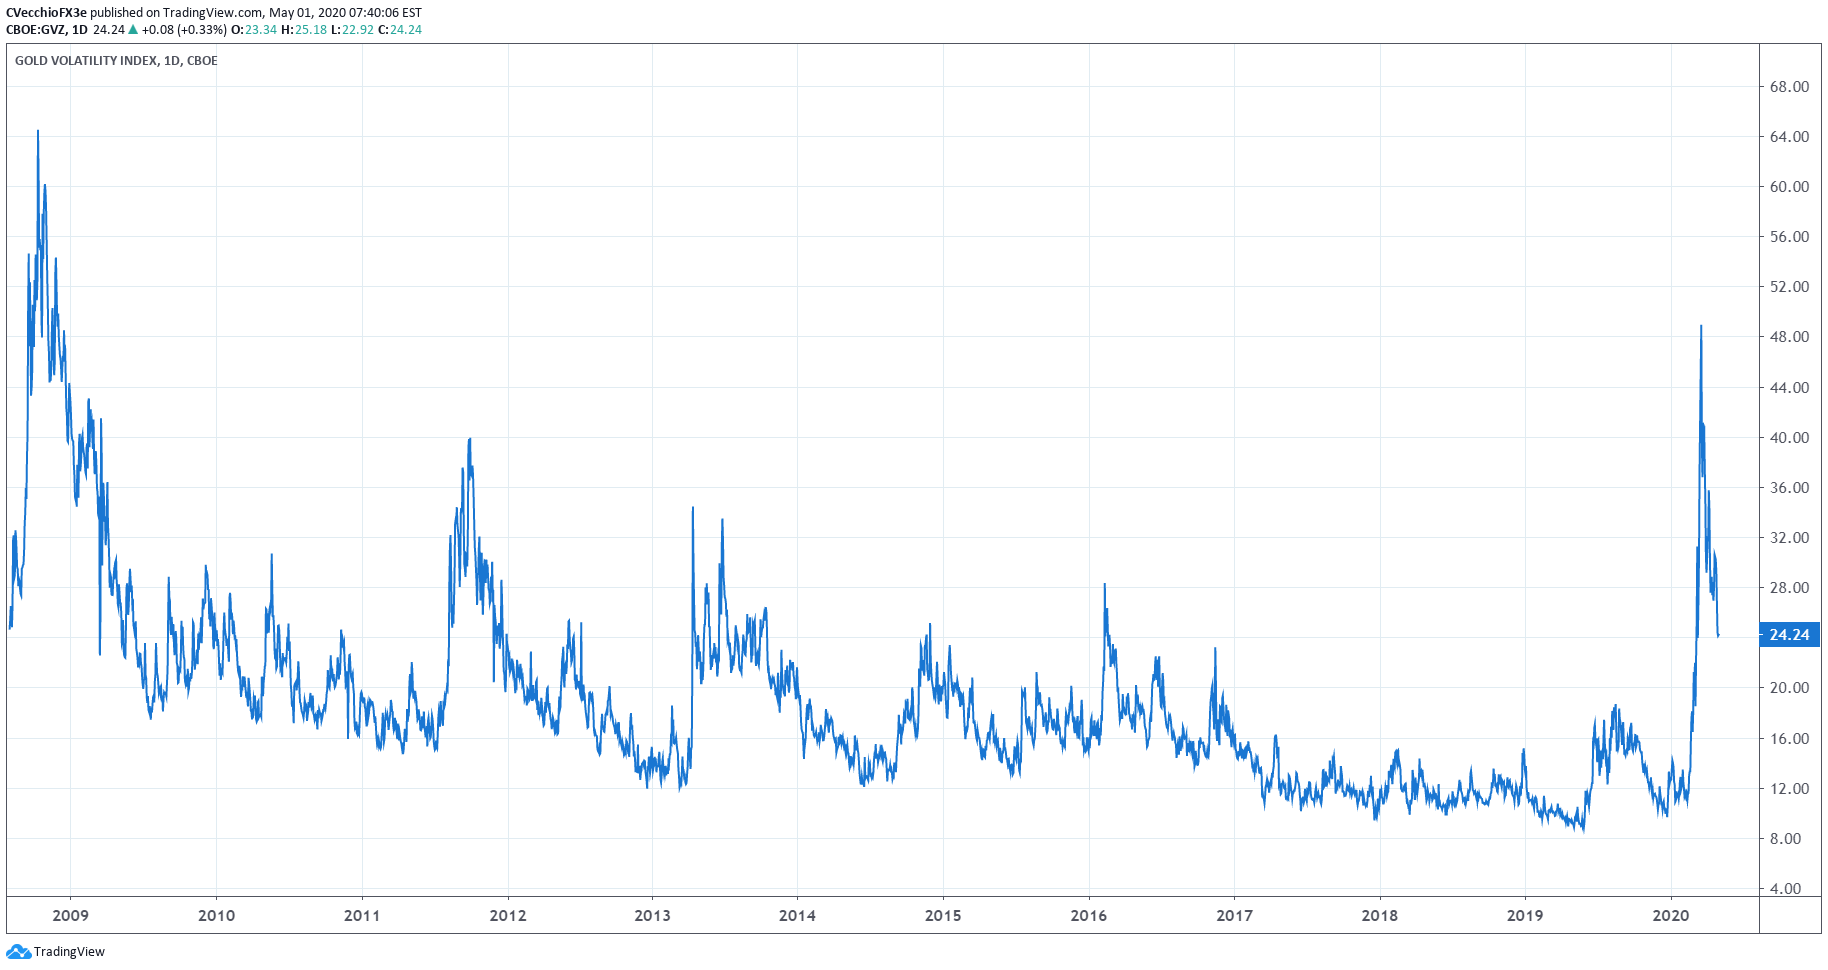
Gold volatility (as measured by the Cboe’s gold volatility ETF, GVZ, which tracks the 1-month implied volatility of gold as derived from the GLD option chain) is trading at 24.24, quickly approaching its coronavirus pandemic low set on March 16 at 23.96.
The 5-day correlation between GVZ and gold prices is 0.76 while the 20-day correlation is -0.52; and one week ago, on April 24, the 5-day correlation was 0.09 and the 20-day correlation was -0.43. It’s worth considering that, despite gold volatility near its coronavirus pandemic lows, gold prices are not: gold prices were trading at 1679.81 at the time this report was written; on March 16, gold prices traded as low as 1451.43.
It thus still holds that, as has been the case many times over the past year, when gold volatility falls but gold prices do not follow, leading to a situation of negative correlations in the short-term, it has typically indicated a digestion period for the market prior to further gains.
Gold Price Technical Analysis: Daily Chart (May 2019 to May 2020) (Chart 2)
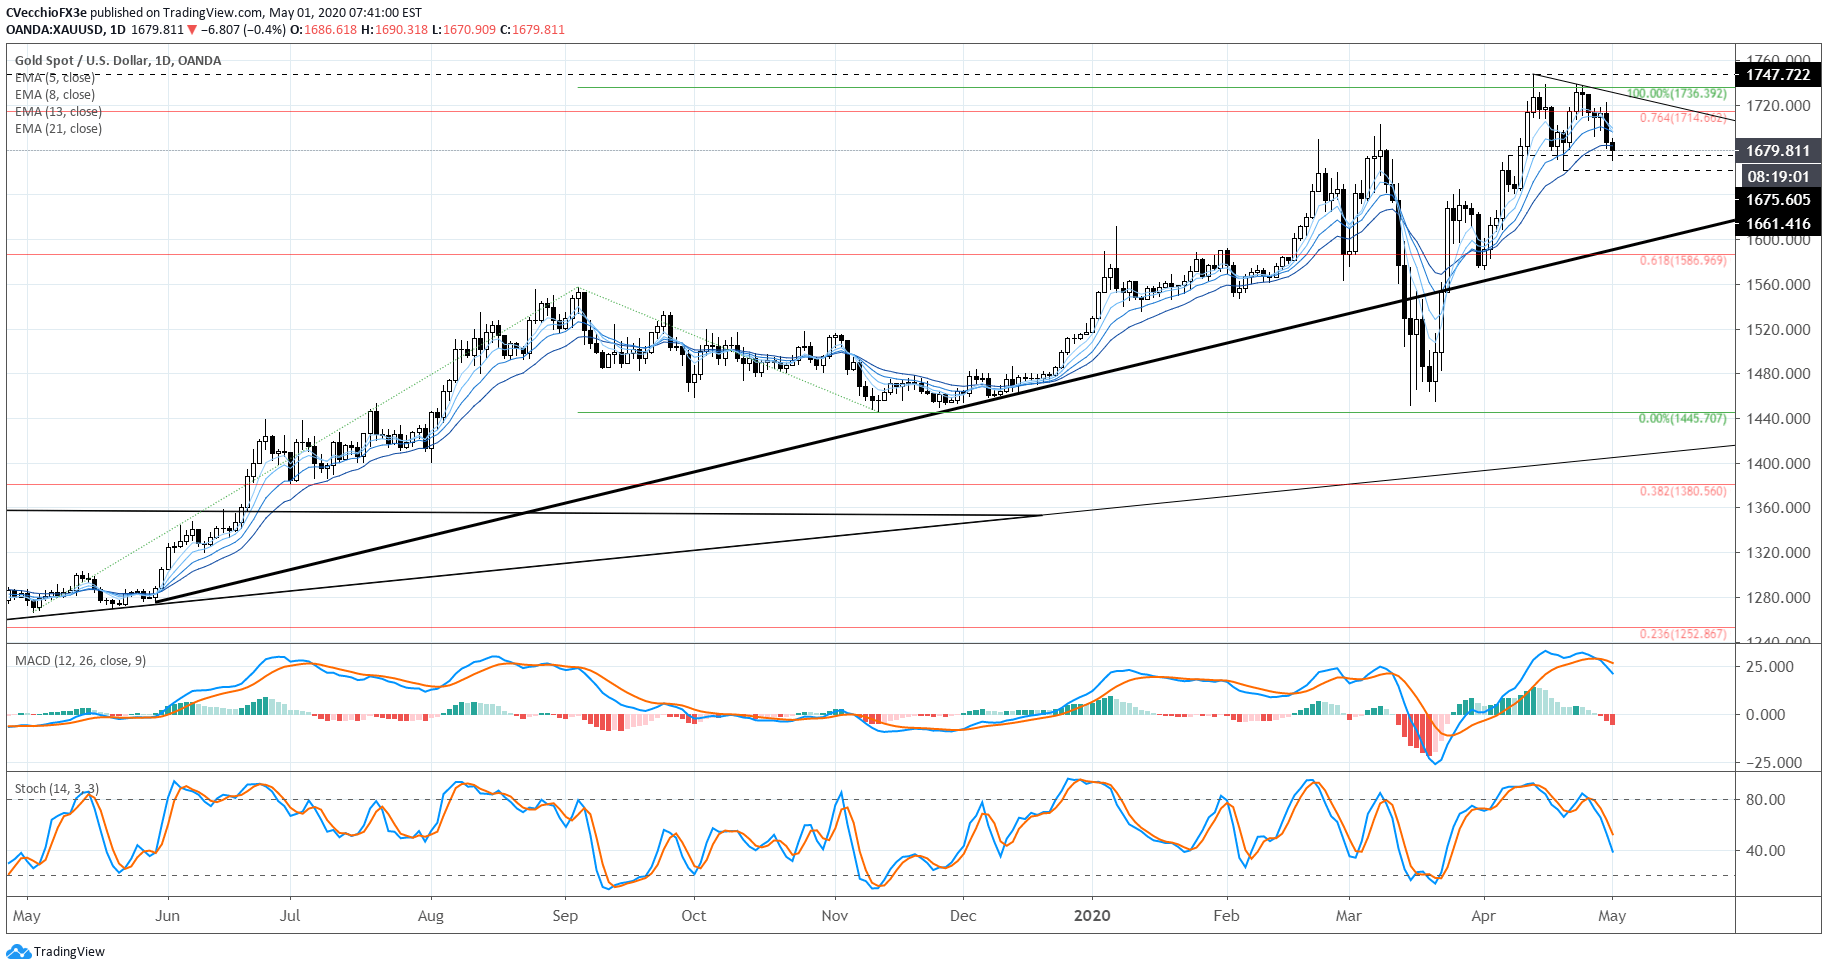
Gold prices continue to consolidate below two key Fibonacci levels, having achieved significant upside targets in the context of both recent and longer-term moves. The two Fibonacci levels referenced are (1) the 100% extension taken from the May 2019 low, September 2019 high, and November 2019 low, with a calculated target at 1736.39, and (2) the 76.4% retracement of the 2011 high to 2015 low range at 1714.66. These have proven to be formidable resistance over the past month.
It thus still holds that the short-term sideways range has been carved out between the April 14/2020 high at 1747.72 and the April 21 swing low (which found support at the daily 21-EMA) at 1661.42. To this end, given the gold prices rallied into this consolidation, the market retains an upside bias. If gold prices do break higher from here, the near-term measured move calls for gains towards 1834.02. If gold prices break the April 21 low of 1661.42, the measured target is 1575.42.
But momentum has cooled off in recent days with gold prices falling above their daily 5-, 8-, 13-, and 21-EMA envelope, which are no longer in bullish sequential order. Daily MACD is falling, albeit in bullish territory. Slow Stochastics are quickly falling back towards their median line. It would appear that “a breach of the yearly highs” may need to wait a little while longer; bulls have some work to do in order to defend the uptrend.
Gold Price Technical Analysis: Weekly Chart – Inverse Head and Shoulders Pattern (May 2011 to May 2020) (Chart 3)

Gold prices have made significant progress within the confines of the multi-year inverse head & shoulders pattern, achieving their highest level since November 2012 earlier this week. It thus still holds that the rally into and through the 76.4% retracement (1714.66) must be viewed in context of the longer-term technical picture: the gold price inverse head and shoulders pattern that originated earlier this year is still valid and guiding gold price action.
Depending upon the placement of the neckline, the final upside targets in a potential long-term gold price rally, if drawing the neckline breakout against the August 2013 high at 1433.61, calls for a final target at 1820.99. This dovetails neatly with the measured move on the daily timeframe looking for gold prices to rally into 1834.02.
IG Client Sentiment Index: Gold Price Forecast (May 1, 2020) (Chart 4)

Gold: Retail trader data shows 71.86% of traders are net-long with the ratio of traders long to short at 2.55 to 1. The number of traders net-long is 5.43% lower than yesterday and 2.35% lower from last week, while the number of traders net-short is 1.90% higher than yesterday and 10.18% lower from last week.
We typically take a contrarian view to crowd sentiment, and the fact traders are net-long suggests Gold prices may continue to fall.
Positioning is less net-long than yesterday but more net-long from last week. The combination of current sentiment and recent changes gives us a further mixed Gold trading bias.

--- Written by Christopher Vecchio, CFA, Senior Currency Strategist


