


USDJPY PRICE FORECAST BEARISH WITH PROSPECT OF MORE FOMC RATE CUTS ON THE HORIZON
- USDJPY is particularly sensitive to changes in interest rates and risk appetite
- USDJPY could soon target the 104.00 handle if the FOMC capitulates to the market’s lofty rate cut expectations
- Download our free DailyFX Forecasts and Trading Guides for comprehensive market insight
USDJPY could be primed to print another fresh year-to-date low as the Japanese Yen gains ground relative to its USD counterpart. Bearish outlook on spot USDJPY price action is owed primarily to the recent resurgence in Fed rate cut bets, which have ballooned in response to dismal data readings on the US economy – like the latest ISM Services PMI report. In fact, the probability that the FOMC cuts rates later this month and for a third consecutive Fed meeting has skyrocketed from a 40% chance on Monday to over 90% at the time of writing this analysis.
Further evidence of economic weakness is likely to be met with more accommodative monetary policy from the Fed seeing that Chair Powell stated during his September FOMC meeting press conference that “if, in fact, the economy weakens more, then we’re prepared to be aggressive.” Taking a look at a long-term chart, spot USDJPY price action since 2015 reveals the forex pair’s pennant chart pattern and most recent bearish leg etched out so far this year.
USDJPY PRICE CHART: WEEKLY TIME FRAME (JUNE 05, 2016 TO OCTOBER 03, 2019)

The drift lower in spot USDJPY prices has been driven predominantly by a dovish shift in monetary policy from the Federal Reserve as well as widespread risk aversion amid ongoing trade war uncertainty and slowing global GDP growth. This is due to the Japanese Yen’s posturing as an interest rate sensitive and sentiment-geared currency seeing that JPY is commonly used to fund the popular forex carry trade.
This generally leads market participants to bid up the Yen when interest rate differentials contract or risk appetite deteriorates. As such, spot USDJPY bears may very well continue to steer prices lower if Fed capitulation is confirmed at upcoming FOMC meetings, which brings the ascending support line into focus that connects the June 2016 and August 2019 swing lows.
USDJPY PRICE CHART: WEEKLY TIME FRAME (DECEMBER 10, 2017 TO OCTOBER 03, 2019)
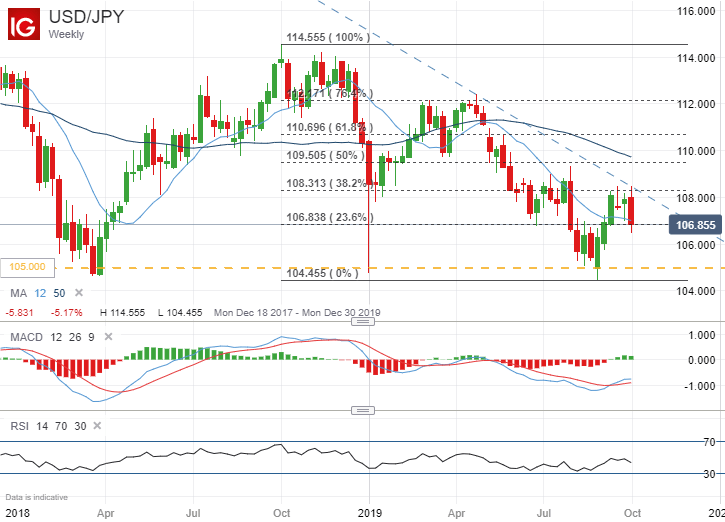
Another rejection at the 108.00 handle this week was constructive for spot USDJPY bears and underpins the currency pair’s broader downtrend throughout the year as ongoing risk aversion and an increasingly dovish Fed has kept the Japanese Yen bid against the greenback. A breach of this bearish trendline could open up the door to additional upside and cause a shift in trader sentiment in favor of spot USDJPY bulls. The IG Client Sentiment Report provides real-time insight on retail trader positioning, which can be used to identify the relative bearish or bullish biases among market participants.
Keeping close tabs on the 106.80-106.50 zone of confluent support going forward will be key, which is highlighted by the currency pair’s 23.6% Fibonacci retracement of its trading range since October 2018 and its 12-week simple moving average (reflecting 1 quarter of performance). That said, upward momentum is beginning to show signs of ebbing as the MACD appears to be rolling over while the negative sloping RSI slipped back beneath 50. Alas, the September 1 swing low around 105.70 could come into focus as a potential downside target before bears eye triple bottom support between the 104.00-105.00 price level.
-- Written by Rich Dvorak, Junior Analyst for DailyFX.com
Connect with @RichDvorakFX on Twitter for real-time market insight


