


Canadian Dollar Technical Price Outlook: Near-term Trade Levels
- Canadian Dollar updated technical trade levels – Daily & Intraday Charts
- USD/CAD carves monthly opening-range above key lateral support
- Key resistance at 1.2782– Break / close below 1.2579 needed to mark trend resumption
The Canadian Dollar is up more than 1% against the US Dollar since the start of the week with USD/CAD pressing the lower bounds of a multi-week range in price. While the broader downtrend remains intact, the immediate decline may be vulnerable here near-term as Loonie tests major technical support. These are the updated targets and invalidation levels that matter on the USD/CAD price charts heading into the close of the year. Review my latest Strategy Webinar for an in-depth breakdown of this Loonie technical setup and more.
Canadian Dollar Price Chart – USD/CAD Daily
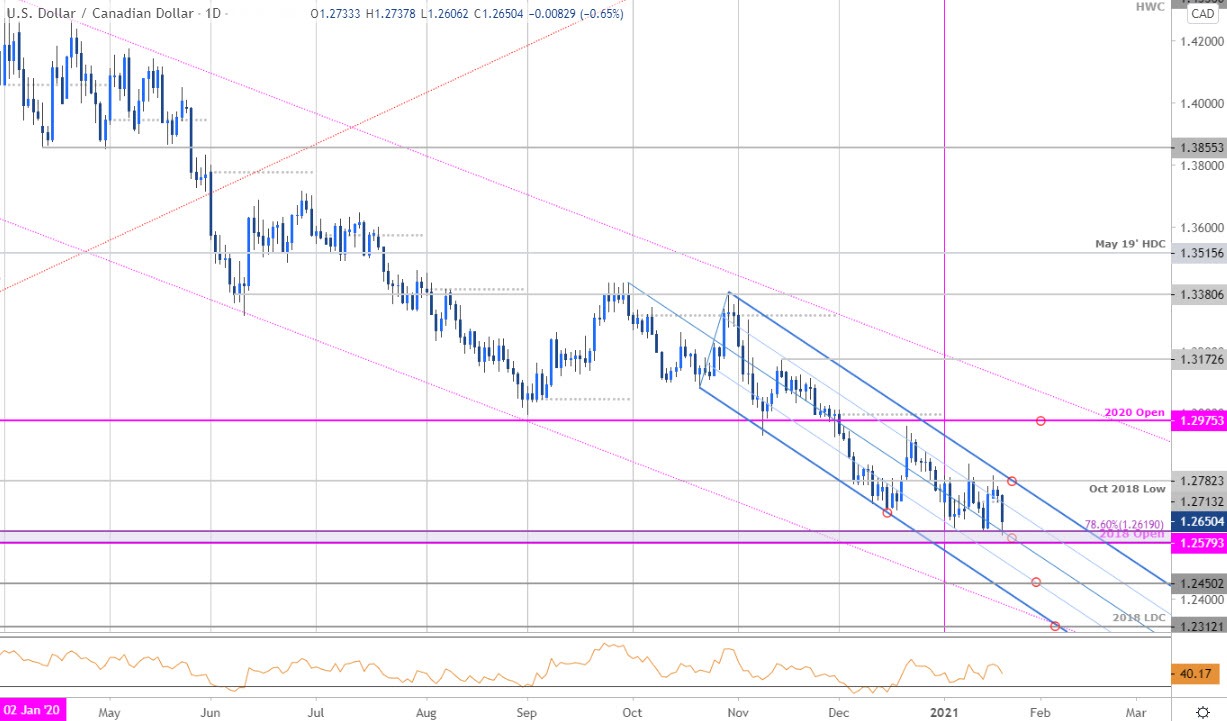
Chart Prepared by Michael Boutros, Technical Strategist; USD/CAD on Tradingview
Technical Outlook: In my last Canadian Dollar Price Outlook we noted that the USD/CAD recovery was approaching down trend resistance with a, “close below 1.2782 would be needed to threaten another run at the lows.” A breakdown into the close of the year fueled a decline into a key support zone we’ve been tracking for months now at 1.2579-1.2647- a region defined by the 2018 objective yearly open and the 78.6% Fibonacci retracement of the 2017 advance. Note that the January opening-range lows also converge on this threshold – we’re looking for inflection in the days ahead for guidance here.
A break / close below is needed to mark resumption of the broader down trend towards the 25% parallel near the 1.25-handle and 1.2450. Critical long-term support rests lower at the 2018 low-day close / lower parallels at 1.2312. Resistance / bearish invalidation now lowered to the October 2018 low at 1.2782 – a breach / close above this pitchfork would be needed to suggest a more significant reversal is underway.
Canadian Dollar Price Chart – USD/CAD 240min

Notes: A closer look at Loonie price action shows USD/CAD testing the median-line today with a multi-week range taking shape just above this near-term support zone. Look for topside exhaustion ahead of weekly open resistance at 1.2727 IF price is indeed heading lower with a break likely to fuel accelerated losses towards the lower parallels.

Bottom line: The Canadian Dollar has carved out a well-defined monthly opening-range just above major lateral support. From a trading standpoint, a good zone to reduce short-exposure / lower protective stops – look for inflection here with a close below needed to keep the immediate decline viable. Review my latest Canadian Dollar Weekly Price Outlook for a closer look at the longer-term USD/CAD technical trade levels.
For a complete breakdown of Michael’s trading strategy, review his Foundations of Technical Analysis series on Building a Trading Strategy
Canadian Dollar Trader Sentiment – USD/CAD Price Chart
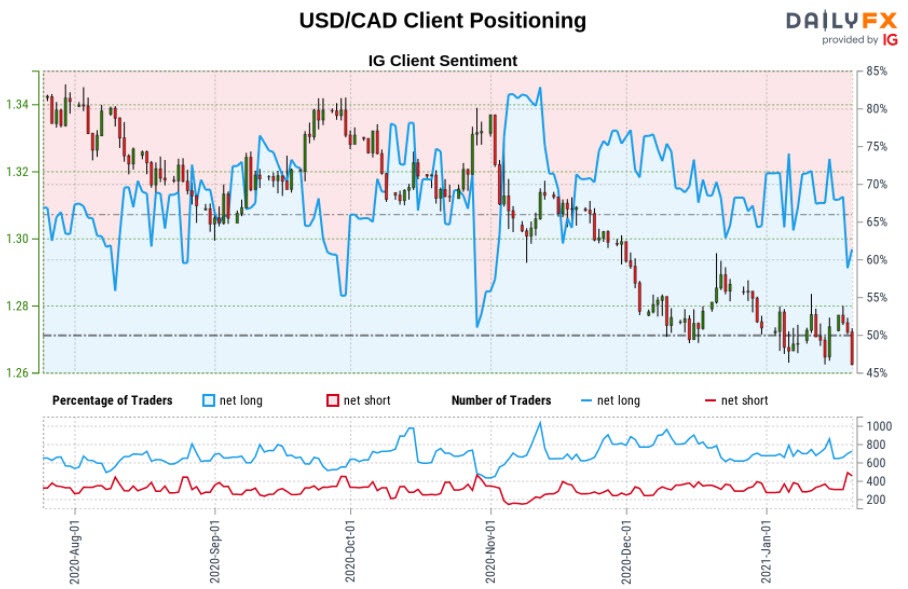
- A summary of IG Client Sentiment shows traders are net-long USD/CAD - the ratio stands at +1.85 (64.90% of traders are long) – typically bearish reading
- Long positions are2.89% higher than yesterday and 2.22% higher from last week
- Short positions are 6.81% lower than yesterday and 16.48% higher from last week
- We typically take a contrarian view to crowd sentiment, and the fact traders are net-long suggests USD/CAD prices may continue to fall. Traders are more net-long than yesterday but less net-long from last week and the combination of current positioning and recent changes gives us a further mixed USD/CAD trading bias from a sentiment standpoint.
| Change in | Longs | Shorts | OI |
| Daily | -2% | 7% | 5% |
| Weekly | -30% | 38% | 13% |
---
Key US / Canada Data Releases
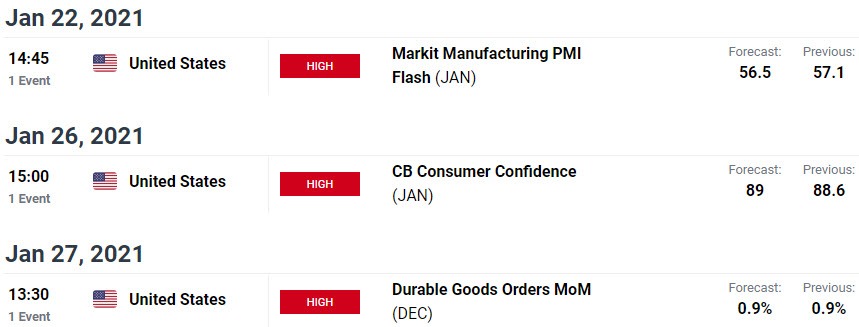
Economic Calendar - latest economic developments and upcoming event risk.
Active Technical Setups
- Mexican Peso Outlook: USD/MXN Breakdown to Nine-month Lows
- Australian Dollar Outlook: Aussie Building Breakout- AUD/USD Levels
- Gold Price Outlook: Gold Breakout Rejected – XAU/USD Bulls Beware
- Euro Outlook: EUR/USD Rips to 2020 Highs- Bulls Face Trend Resistance
- Written by Michael Boutros, Currency Strategist with DailyFX
Follow Michael on Twitter @MBForex


