


Canadian Dollar Technical Price Outlook: USD/CAD Weekly Trade Levels
- Canadian Dollar updated technical trade levels - Weekly Chart
- USD/CAD correction approaching April lows / key technical support confluence
- Risk is lower sub-1.4173 – key support zone at 1.3763-1.3812
The Canadian Dollar rallied more than 1.4% against the US Dollar this week with USD/CAD sliding to fresh monthly lows on Wednesday. The move takes Loonie within striking distance of the April lows in USD/CAD with a critical support zone just lower. While the risk remains tilted to the downside, the near-term decline may be vulnerable heading into these level. These are the updated targets and invalidation levels that matter on the USD/CAD weekly technical price chart. Review my latest Weekly Strategy Webinar for an in-depth breakdown of this Loonie trade setup and more.
Canadian Dollar Price Chart – USD/CAD Weekly
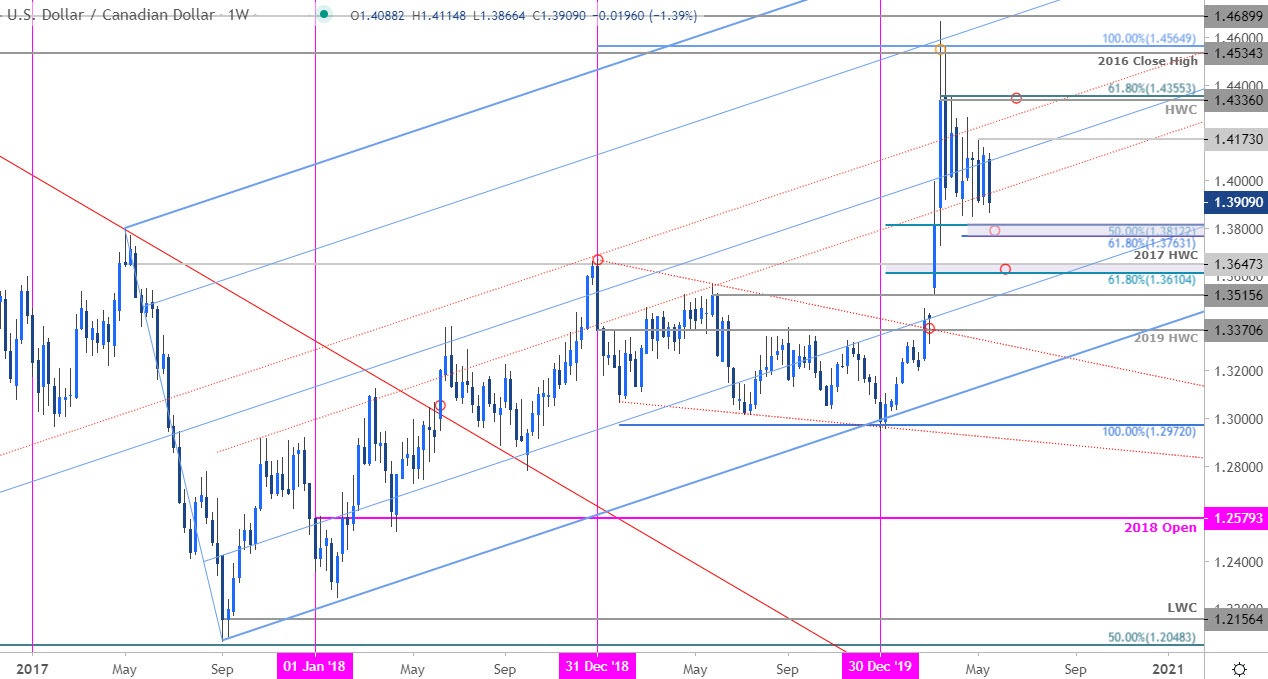
Chart Prepared by Michael Boutros, Technical Strategist; USD/CAD on Tradingview
Notes: In last month’s Canadian Dollar Weekly Price Outlook we noted that the USD/CAD breakout had, “stalled at major uptrend confluence resistance. From at trading standpoint, the risk remains for a deeper pullback in price while below the high-week close.” Price has continued to consolidate just above the April lows with key daily support seen just lower at the 50% retracement of the yearly range / 61.8% ext of the March decline at 1.3763-1.3812 – look for a larger reaction there for guidance with a close below needed to keep the focus on 1.3610/47. Initial resistance stands with the May opening-range highs at 1.4173 – ultimately a breach / close above the high-week close / 61.8% retracement at 1.4336/55 is needed to mark resumption of the broader uptrend.

Bottom line: The USD/CAD correction is approaching the April range lows with confluence support just lower. While risk remains lower, the immediate decline may be vulnerable heading into these levels. From at trading standpoint, look to reduce short-exposure / lower protective stops on a stretch lower with a close below 1.3793 needed to keep the short-bias viable. Ultimately, a larger pullback may offer more favorable long-entries closer to broader uptrend support. I’ll publish an updated Canadian Dollar Price Outlook once we get further clarity on the near-term USD/CAD technical trade levels.
For a complete breakdown of Michael’s trading strategy, review his Foundations of Technical Analysis series on Building a Trading Strategy
Canadian Dollar Trader Sentiment – USD/CAD Price Chart
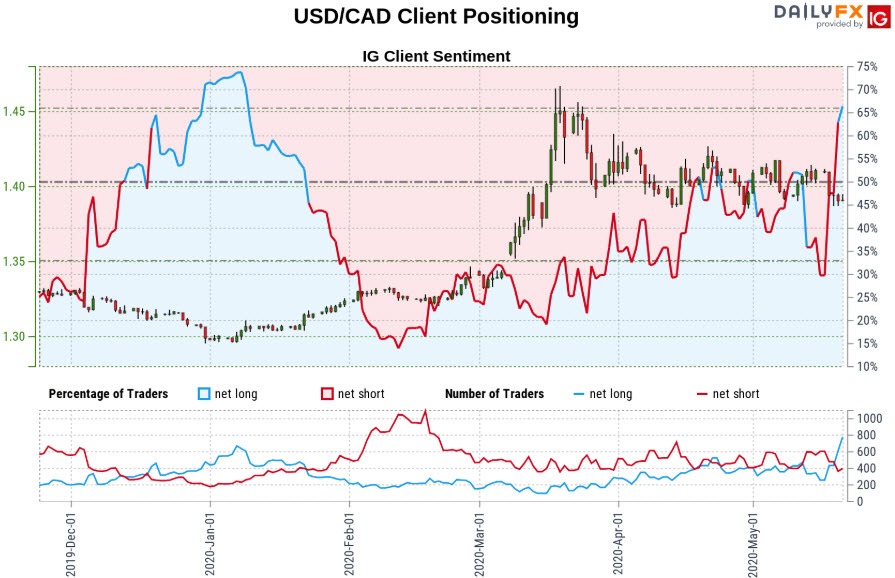
- A summary of IG Client Sentiment shows traders are net-long USD/CAD - the ratio stands at 1.73 (63.35% of traders are long) – bearish reading
- Long positions are14.35% higher than yesterday and 114.33% higher from last week
- Short positions are1.62% lower than yesterday and 35.17% lower from last week
- We typically take a contrarian view to crowd sentiment, and the fact traders are net-long suggests USD/CAD prices may continue to fall. Traders are further net-long than yesterday and last week, and the combination of current positioning and recent changes gives us a stronger USD/CAD-bearish contrarian trading bias from a sentiment standpoint.
| Change in | Longs | Shorts | OI |
| Daily | -2% | 7% | 5% |
| Weekly | -30% | 38% | 13% |
---
Key US / Canada Data Releases
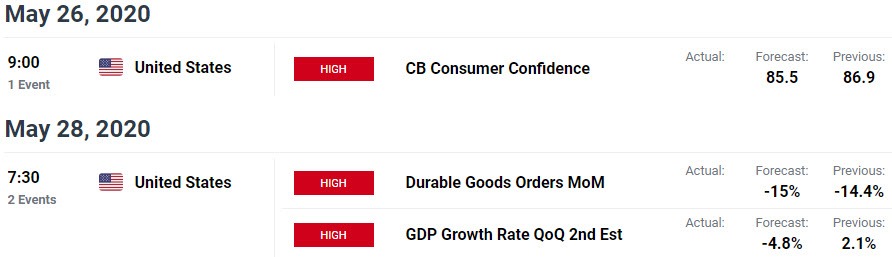
Economic Calendar - latest economic developments and upcoming event risk.
Previous Weekly Technical Charts
- Euro (EUR/USD)
- Gold (XAU/USD)
- Mexican Peso (USD/MXN)
- Japanese Yen (USD/JPY)
- Sterling (GBP/USD)
- US Dollar (DXY)
- Crude Oil (WTI)
--- Written by Michael Boutros, Technical Currency Strategist with DailyFX
Follow Michael on Twitter @MBForex


