


US Dollar Technical Price Outlook: DXY Weekly Trade Levels
- US Dollar technical trade level update – Daily & Intraday Charts
- USD plummets for sixth consecutive week / decline now testing confluence support
- DXY bears vulnerable while above 93.23- bearish invalidation lowered to 95.03
The US Dollar has plummeted more than 9.5% off the March yearly highs with DXY now down nearly 3.5% year-to-date. The decline has extended for a sixth consecutive week with price now testing near-term support into the close of July trade. These are the updated technical targets and invalidation levels that matter on the US Dollar Index (DXY) weekly price chart. Review my latest Strategy Webinar for an in-depth breakdown of this Dollar trade setups and more.
US Dollar Index Price Chart – DXY Weekly
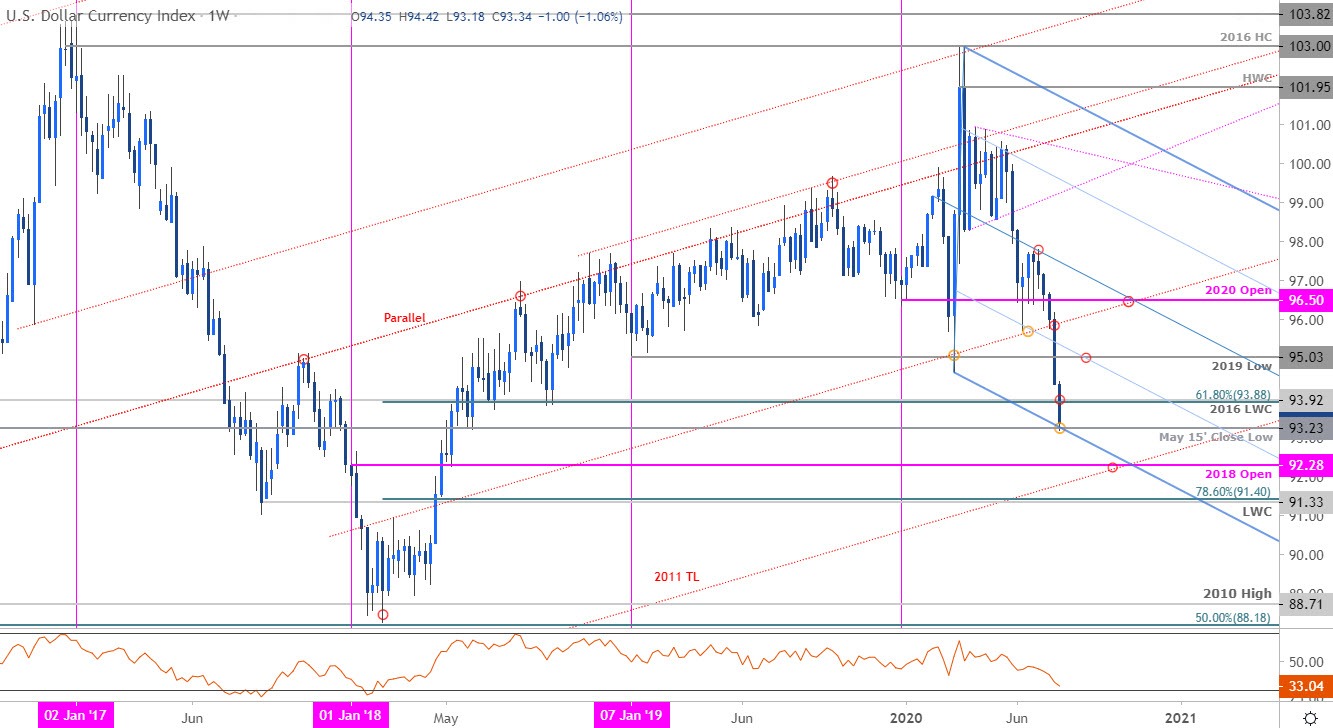
Chart Prepared by Michael Boutros, Technical Strategist; US Dollar Index on Tradingview
Notes: In last month’s US Dollar Weekly Price Outlook noted that a rebound off confluence support had fueled a near-term recovery in the index with, “97.83 & 98.50- both regions of interest for possible topside exhaustion IF reached.” Price registered a high at 97.80 in the following days before resuming lower with the decline now attempting to mark its sixth consecutive week. The sell-off has broken below the objective yearly opening-range lows with the index now approaching the next support level around 93.23- a pivot zone defined by the May 2015 close lows and converges on the lower parallel of a broader descending pitchfork formation extending off the yearly high.
A break / close below this threshold is needed to keep the short-bias viable with such a scenario exposing subsequent support objectives at 92.28 and the 2017 low-week close / 78.6% Fibonacci retracement at 91.33/40– both key levels in price. Initial resistance now back at the 2016 low-week close / 61.8% retracement at 93.88/92 with bearish invalidation now lowered to the 25% parallel / 2019 low at 95.03.
For a complete breakdown of Michael’s trading strategy, review his Foundations of Technical Analysis series on Building a Trading Strategy
Bottom line: The US Dollar sell-off is poised to complete a sixth weekly decline to fresh yearly lows into confluence support – look for a reaction down here with the shorts vulnerable near-term. From a trading standpoint a good zone to reduce short-exposure / lower protective stop – keep an eye out for topside exhaustion ahead of the 95-handle IF the index is indeed heading lower with a close sub-93.23 needed to keep the focus on longer-term uptrend support near 92.20s. I’ll publish and updated US Dollar Price Outlook one we get further clarity on the near-term DXY technical trade levels.

---
Key US Data Releases
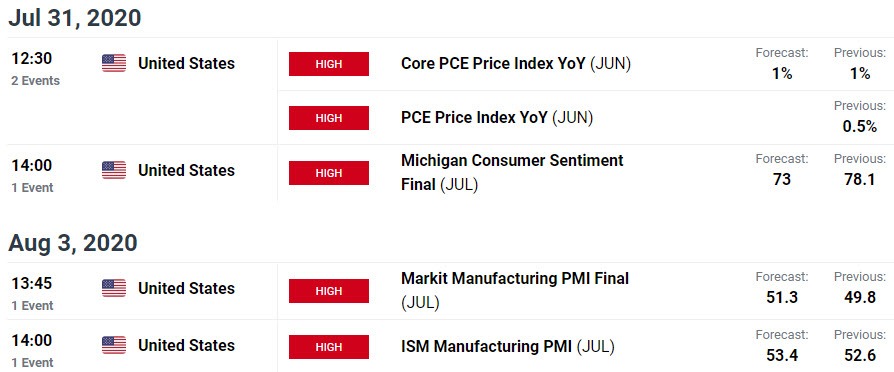
Economic Calendar - latest economic developments and upcoming event risk.
Previous Weekly Technical Charts
- Gold (XAU/USD)
- Australian Dollar (AUD/USD)
- Sterling (GBP/USD)
- New Zealand Dollar (NZD/USD)
- Japanese Yen (USD/JPY)
- Euro (EUR/USD)

--- Written by Michael Boutros, Technical Strategist with DailyFX
Follow Michael on Twitter @MBForex


