


New Zealand Dollar Technical Price Outlook: NZD/USD Weekly Trade Levels
- New Zealand Dollar updated technical trade levels - Weekly Chart
- NZD/USD rallies 20%+ off yearly lows- stalling at multi-year downtrend resistance
- Kiwi advance vulnerable while below 6628 – critical support 6313
The New Zealand Dollar is poised to snap a three-week winning streak against the US Dollar with the Kiwi rally faltering at log-term down-trend resistance. The advance may be vulnerable here as momentum stalls and with the bulls at risk into the 66-handle. These are the updated targets and invalidation levels that matter on the NZD/USD weekly price chart heading into next week. Review my latest Strategy Webinar for an in-depth breakdown of this Kiwitrade setup and more.
New Zealand Dollar Price Chart – NZD/USD Weekly

Chart Prepared by Michael Boutros, Technical Strategist; NZD/USD on Tradingview
Notes: In my last New Zealand Dollar Weekly Price Outlook we noted that a breakout in NZD/USD had fueled a rally into confluence slope resistance heading into the close of June trade with initial support eyed, “at the 2019 low-week close at 6313.” The Kiwi pullback registered a low at 6380 in the following weeks before mounting a counteroffensive with price now challenging a key technical confluence at 6585-6628- a region defined by the June highs & the 100% extension the March rally and converges on long-term downtrend resistance (blue). Note that weekly RSI has held sub-60 since the start of the year and casts a bearish momentum profile while below this threshold.
Initial weekly support now raised to the March trendline / late-June lows at 6380 with bullish invalidation now raised to the 2019 low-week close at 6313- weakness beyond this threshold would risk a larger scale Kiwi correction. A breach / close above 6628 is needed to keep the long-bias viable with critical resistance eyed at the 2019 / 2020 yearly opens at 6705/33- look for a more significant reaction there IF reached.

Bottom line: The New Zealand Dollar rally is testing confluence slope resistance here and leaves the broader advance vulnerable heading in 6628. From a trading standpoint, a good region to reduce long-exposure / raise protective stops – look for downside exhaustion ahead of 6380 IF price is heading higher with a close above 6628 needed to fuel the next leg up in price. I’ll publish an updated New Zealand Dollar Price Outlook once we get further clarity on the near-term NZD/USD technical trade levels.
For a complete breakdown of Michael’s trading strategy, review his Foundations of Technical Analysis series on Building a Trading Strategy
New Zealand Dollar Trader Sentiment – NZD/USD Price Chart
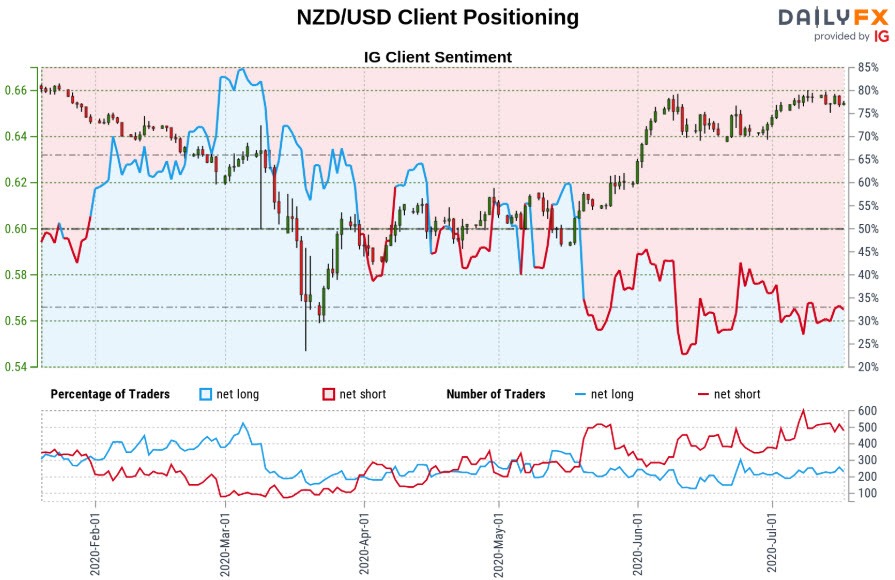
- A summary of IG Client Sentiment shows traders are net-short NZD/USD - the ratio stands at -2.00 (33.38% of traders are long) – bullish reading
- Long positions are 5.33% higher than yesterday and 2.47% lower from last week
- Short positions are 12.57% lower than yesterday and 11.59% lower from last week
- We typically take a contrarian view to crowd sentiment, and the fact traders are net-short suggests NZD/USD prices may continue to rise. Yet traders are less net-short than yesterday and compared with last week. Recent changes in sentiment warn that the current NZD/USD price trend may soon reverse lower despite the fact traders remain net-short.
Key New Zealand / US Economic Releases
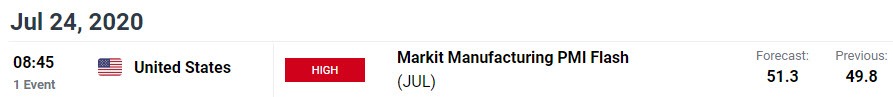
Economic Calendar - latest economic developments and upcoming event risk.
Previous Weekly Technical Charts
- Gold (XAU/USD)
- Australian Dollar (AUD/USD)
- British Pound (GBP/USD)
- Gold (XAU/USD)
- Japanese Yen (USD/JPY)
- Euro (EUR/USD)
- US Dollar (DXY)
- Canadian Dollar (USD/CAD)
--- Written by Michael Boutros, Technical Currency Strategist with DailyFX
Follow Michael on Twitter @MBForex


