


Japanese Yen Technical Price Outlook: DXY Weekly Trade Levels
- Japanese Yen technical trade levels update – Weekly Chart
- USD/JPY sell-off responds to technical support at 106.31
- Broader risk remains for a deeper correction while below yearly open resistance
The Japanese Yen is poised to snap a two week winning streak against the US Dollar with USD/JPY virtually unchanged on Wednesday after rebounding off technical support. While the threat of a broader decline remains, the immediate sell-off may be vulnerable here and a near-term recovery may offer more favorable opportunities. These are the updated targets and invalidation levels that matter on the USD/JPY weekly price chart. Review my latest Strategy Webinar for an in-depth breakdown of this Yen trade setup and more.
Japanese Yen Price Chart – USD/JPY Weekly
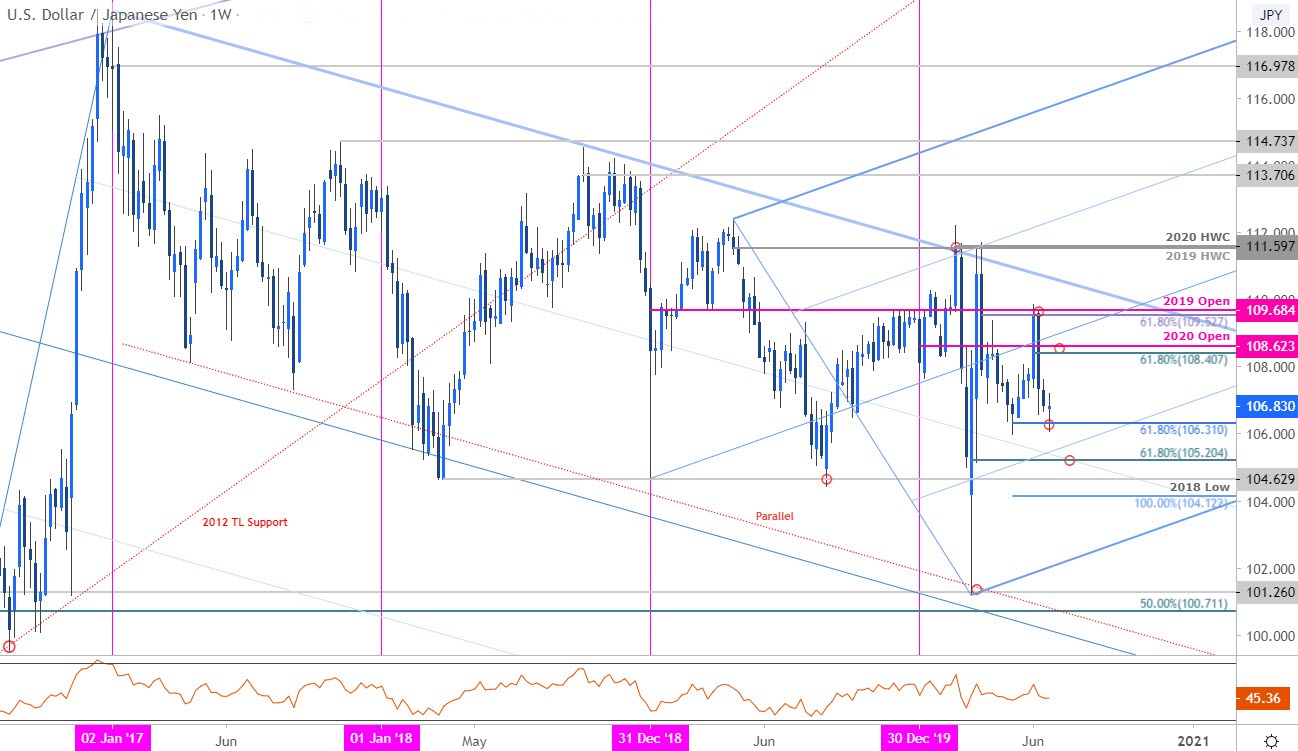
Chart Prepared by Michael Boutros, Technical Strategist; USD/JPY on Tradingview
Notes: In last month’s Japanese Yen Weekly Price Outlook we highlighted critical resistance, “at the 61.8% retracement of the late-March decline / 2019 open at 109.53/68 – look for a larger reaction there for guidance.” The Dollar ripped higher into the open of June trade with a rally of more than 2% failing to close above this key threshold (intraday high registered at 109.85). Price turned sharply lower with the decline now testing the 61.8% extension of the March decline at 106.3- a weekly close below this threshodl is needed to keep the immediate short-bias viable in the days ahead.
Weekly resistance now stands at the 61.8% retracement of the monthly range / 2020 yearly open at 108.40/62 backed by 109.53/68- a close above this threshold is needed to shift the broader focus back to the long-side. A break lower from here exposes subsequent support objectives at 105.20 backed by the 2018 low at 104.62 and the 100% extension at 104.12.

For a complete breakdown of Michael’s trading strategy, review his Foundations of Technical Analysis series on Building a Trading Strategy
Bottom line:The Japanese Yen has covered the last two-month’s range in just the past few three weeks and the focus is on this support zone near the May lows in USD/JPY. From a trading standpoint, a good region to reduce short-exposure / lower protective stops – look for topside exhaustion ahead of yearly open resistance at 108.62 on recoveries IF price is indeed heading lower with a break below exposing key Fibonacci support. Review my latest Japanese Yen Price Outlook for a closer look at the near-term USD/JPY technical trade levels.
Japanese Yen Trader Sentiment – USD/JPY Price Chart
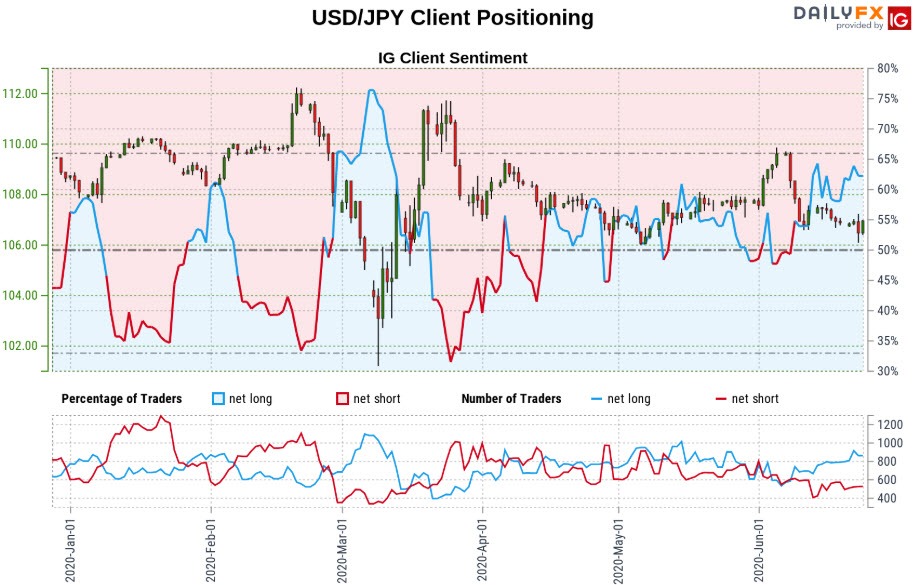
- A summary of IG Client Sentiment shows traders are net-long USD/JPY - the ratio stands at +1.54 (60.71% of traders are long) – bearish reading
- Long positions are1.52% lower than yesterday and 10.07% higher from last week
- Short positions are 14.74% higher than yesterday and 1.68% higher from last week
- We typically take a contrarian view to crowd sentiment, and the fact traders are net-long suggests USD/JPY prices may continue to fall. Traders are less net-long than yesterday but more net-long from last week. The combination of current positioning and recent changes gives us a further mixed USD/JPY trading bias from a sentiment standpoint.
| Change in | Longs | Shorts | OI |
| Daily | -2% | 2% | 0% |
| Weekly | 12% | -16% | -6% |
---
Previous Weekly Technical Charts
- Euro (EUR/USD)
- US Dollar (DXY)
- Canadian Dollar (USD/CAD)
- Gold (XAU/USD)
- New Zealand Dollar (NZD/USD)
- Crude Oil (WTI)
- Australian Dollar (AUD/USD)
- British Pound (GBP/USD)

--- Written by Michael Boutros, Technical Currency Strategist with DailyFX
Follow Michael on Twitter @MBForex


