


New Zealand Dollar Technical Price Outlook: NZD/USD Weekly Trade Levels
- New Zealand Dollar updated technical trade levels - Weekly Chart
- NZD/USD testing confluence trend resistance – rally vulnerable sub-6628
- Check out our 2020 projections in our Free DailyFX USD Trading Forecasts
The New Zealand Dollar has rallied a full 20% off the yearly lows with the advance now approaching a critical zone of slope resistance for both the near-term uptrend and the longer-term downtrend. The focus is on a reaction up here with the recent advance vulnerable while below. These are the updated targets and invalidation levels that matter on the NZD/USD weekly price chart heading into the RBNZ tomorrow. Review my latest Strategy Webinar for an in-depth breakdown of this Kiwitrade setup and more.
New Zealand Dollar Price Chart – NZD/USD Weekly
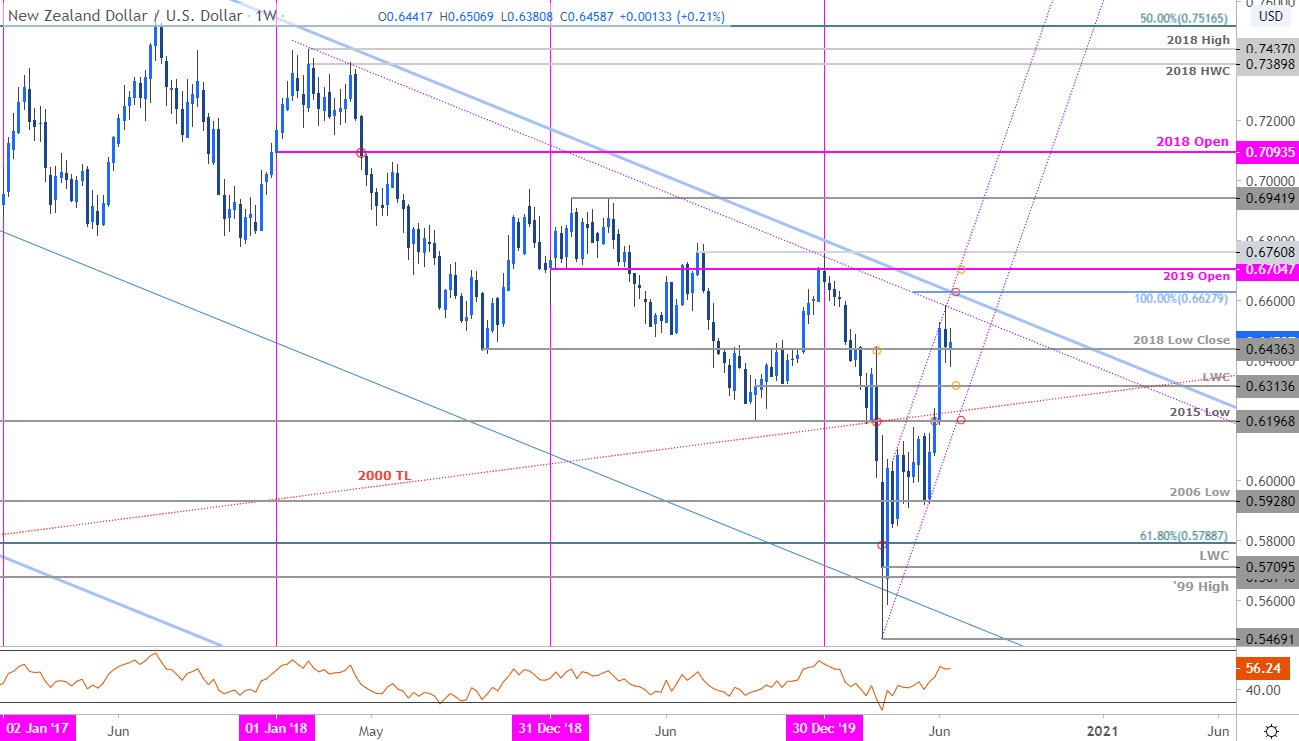
Chart Prepared by Michael Boutros, Technical Strategist; NZD/USD on Tradingview
Notes: The advance off the yearly lows has carved out an ascending channel formation with Kiwi turning last week off confluence slope resistance. Key resistance stands just higher at the 100% extension of the March rally at 6628 – look for a reaction there IF reached with a breach above keeping the focus on the 2019 open at 6705 and the July high-week close at 6760. Initial support rests at the 2019 low-week close at 6313 backed by the 2015 low at 6197- we’ll reserve this threshold as our bullish invalidation level with a break / close below needed to mark resumption of the broader downtrend.

Bottom line: The New Zealand Dollar rally is testing confluence slope resistance here and leaves the medium-term long-bias vulnerable while below. From a trading standpoint, look to reduce long-exposure on stretch towards 6628 with a breach above 6760 ultimately needed to suggest a larger trend reversal is underway. A pullback in price may offer more favorable long-entries closer to uptrend support- be on the lookout for downside exhaustion ahead of 6200 IF price is heading higher. Keep in mind the RBNZ interest rate decision is on tap tomorrow - I’ll publish an updated New Zealand Dollar Price Outlook once we get further clarity on the near-term NZD/USD technical trade levels.
For a complete breakdown of Michael’s trading strategy, review his Foundations of Technical Analysis series on Building a Trading Strategy
New Zealand Dollar Trader Sentiment – NZD/USD Price Chart

- A summary of IG Client Sentiment shows traders are net-short NZD/USD - the ratio stands at -2.16 (31.62% of traders are long) – bullish reading
- Long positions are6.57% lower than yesterday and 27.45% lower from last week
- Short positions are 4.99% higher than yesterday and 0.50% higher from last week
- We typically take a contrarian view to crowd sentiment, and the fact traders are net-short suggests NZD/USD prices may continue to rise. Traders are further net-short than yesterday and last week, and the combination of current positioning and recent changes gives us a stronger NZD/USD-bullish contrarian trading bias from a sentiment standpoint.
Key New Zealand / US Economic Releases

Economic Calendar - latest economic developments and upcoming event risk.
Previous Weekly Technical Charts
- Crude Oil (WTI)
- Australian Dollar (AUD/USD)
- British Pound (GBP/USD)
- Japanese Yen (USD/JPY)
- US Dollar (DXY)
- Canadian Dollar (USD/CAD)
- Euro (EUR/USD)
- Gold (XAU/USD)
--- Written by Michael Boutros, Technical Currency Strategist with DailyFX
Follow Michael on Twitter @MBForex


