


DAX Technical Highlights:
- DAX snaps the neckline of a head-and-shoulders pattern
- Daily levels to watch below on further weakness
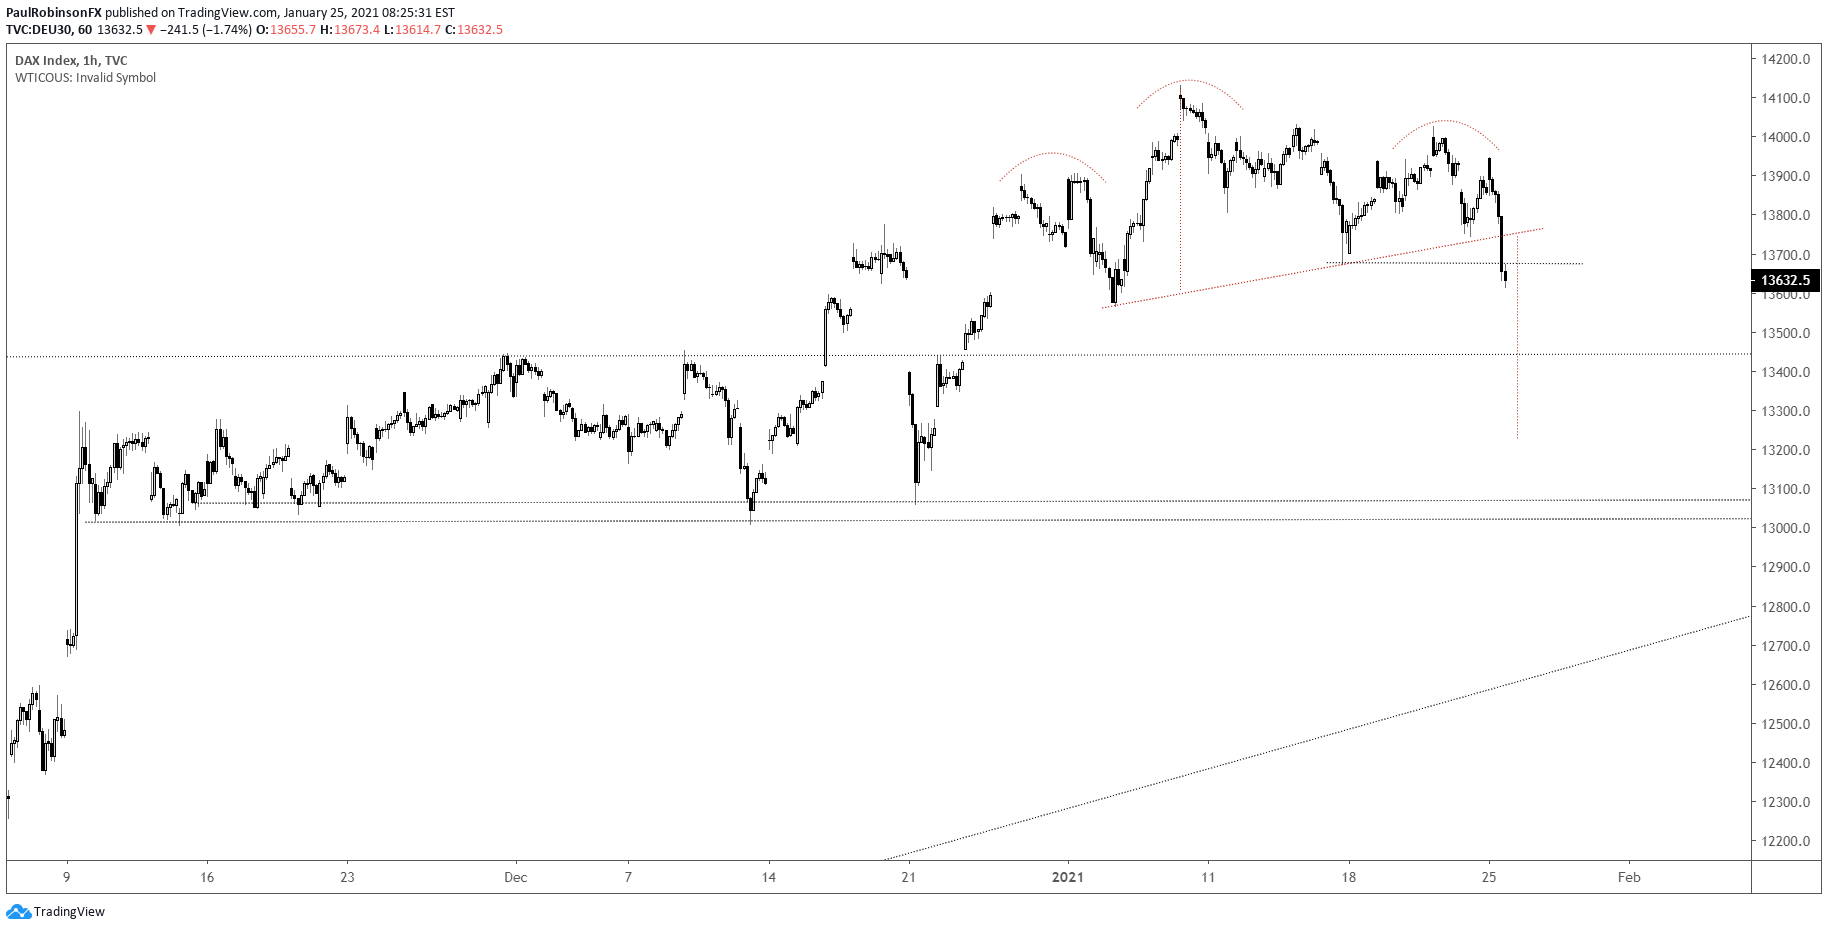
The DAX is breaking lower out of a short-term topping sequence, the pattern discussed on Thursday as having the potential to at least induce a pullback within the context of a larger uptrend.
The head-and-shoulders had been under development since the final days of trading in 2020 when the left shoulder formed. The pattern didn’t come into view until recently of course, when the left shoulder, head, and right shoulder were created.
The breaking of the neckline today on the hourly chart suggests from here the DAX has some room to drop. The measured move target based on the height of the formation (from neckline up the head), implies an approximately 500 point move lower from the neckline that sits at ~13740.
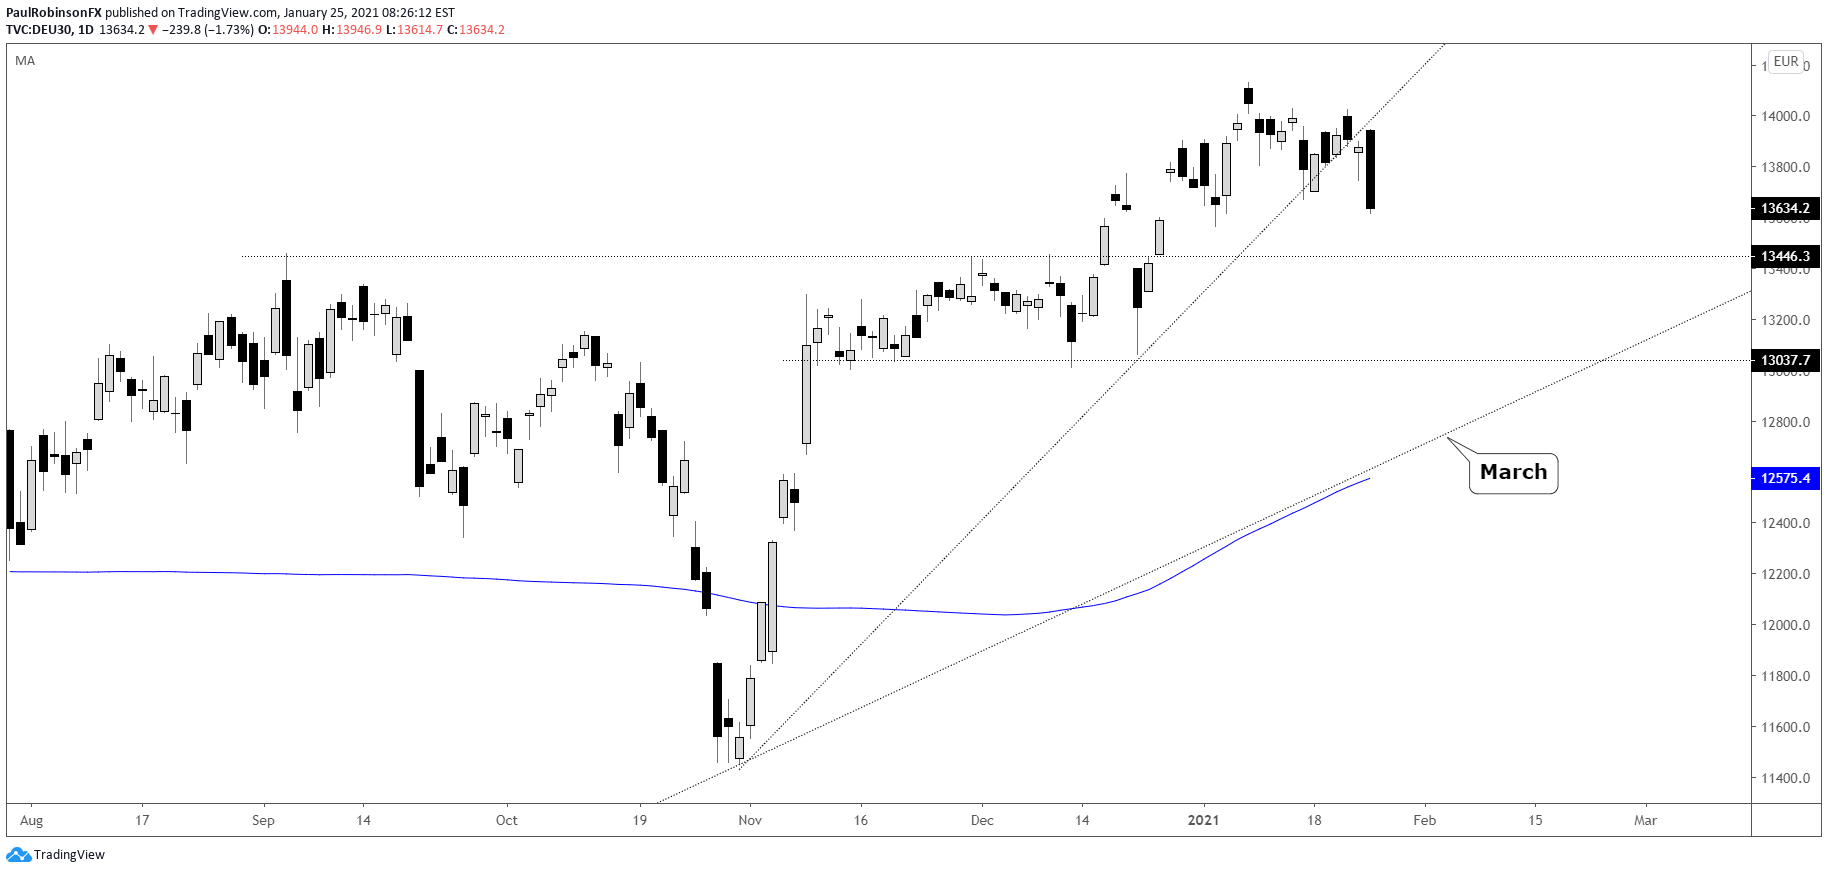
There are ‘actual’ support levels to watch prior to and beneath the projected target. Solid horizontal support is running over from the September high of 13460, that runs across a congestion period from the November/December period.
If price doesn’t hold there, then the low-end of that congestion period is viewed as the next point of support right around the 13k mark. Beneath there is the March trend-line, but would require a sell-off of around 900/1000 points to reach. Maybe in due time…
To negate this bearish sequence, we will need to see price turn back above the neckline and take out the right shoulder at 14026. In the event this happens soon, the false breakdown could lead to a solid surge higher. For now, running with a bearish trading bias.

DAX Hourly Chart (H&S neckline broken)
DAX Daily Chart (watch price action as support levels)
Resources for Forex Traders
Whether you are a new or experienced trader, we have several resources available to help you; indicator for tracking trader sentiment, quarterly trading forecasts, analytical and educational webinars held daily, trading guides to help you improve trading performance, and one specifically for those who are new to forex.
---Written by Paul Robinson, Market Analyst
You can follow Paul on Twitter at @PaulRobinsonFX


