


DAX/CAC Technical Highlights:
- DAX trending higher, consolidating with one short-term bearish possibility
- CAC chart similar to DAX, looking for corona gap-fill on further strength
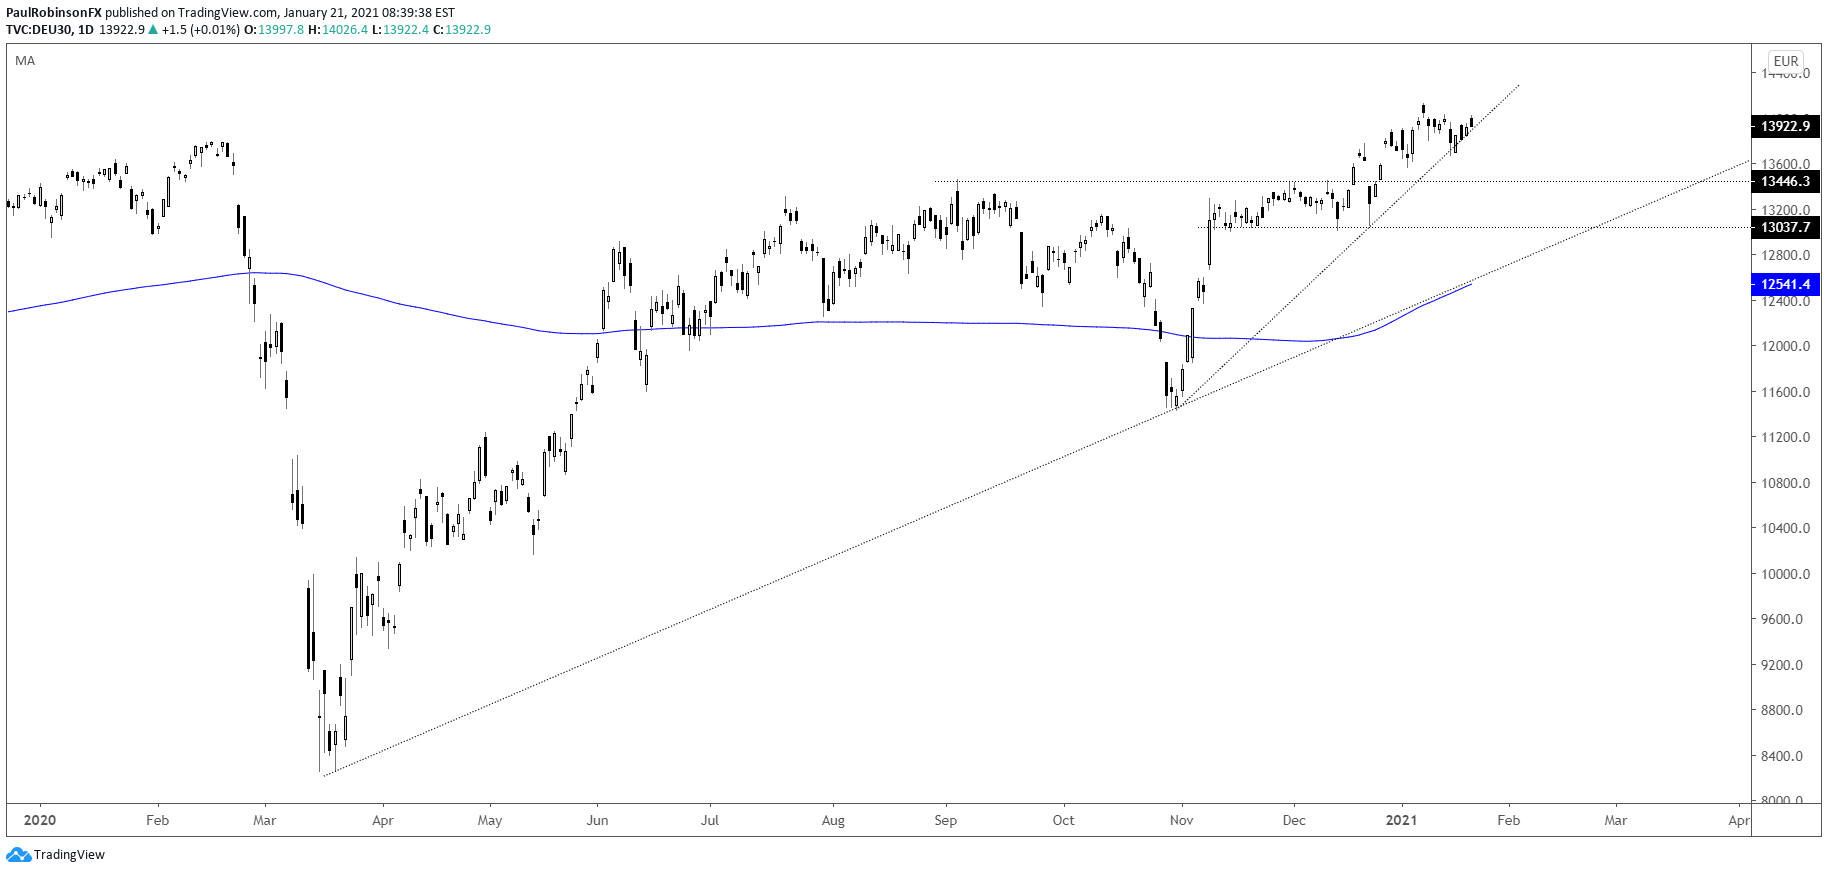
The DAX hasn’t done a whole lot in recent sessions, with it generally holding onto the surge off the October low into the end of the year. The general sideways behavior suggests that the index may be consolidating for another move higher.
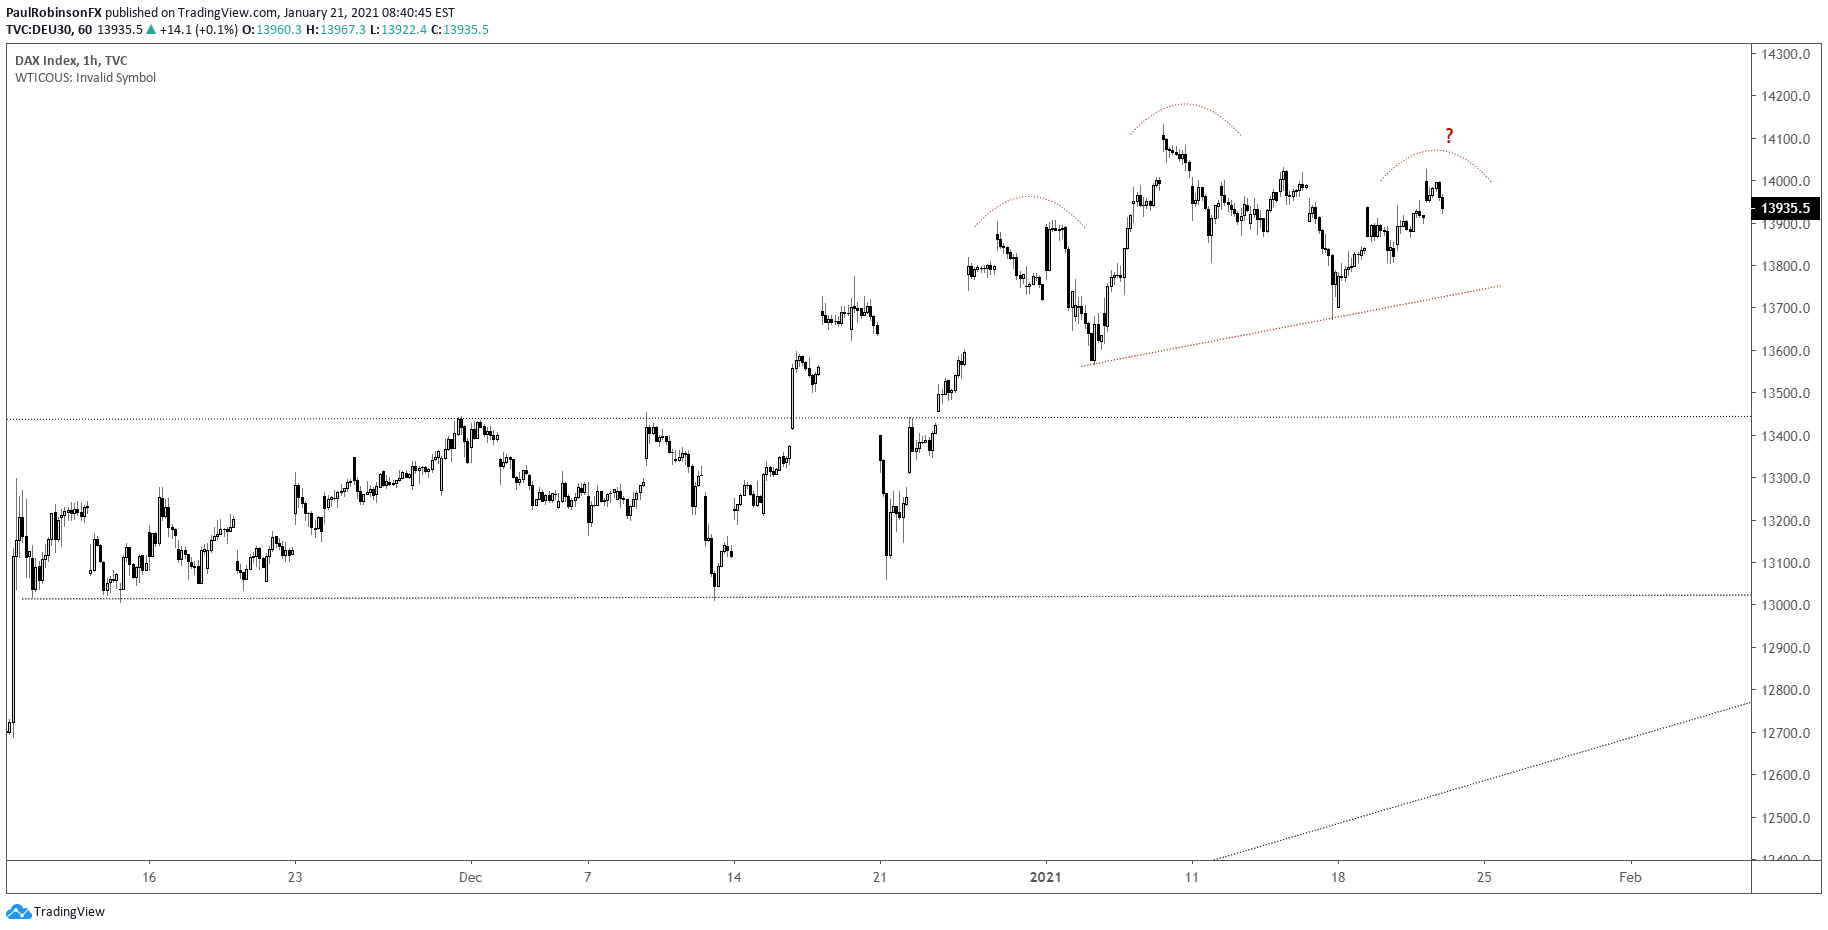
There is one short-term bearish possibility, though.
When you look closely a head-and-shoulders pattern is in the works, but not fully formed. Until it is fully formed and breaks the neckline it is only a pattern in development. Often times they look like they will come to fruition, but never confirm through a breach of the neckline.
Without confirmation the generally horizontal price action smacks of a bullish continuation pattern. For now, awaiting to see which path the DAX wants to take. Also acting as a guide is the trend-line off the October low.
Holding the trend-line and failing to confirm the neckline of the H&S pattern will keep the upward track in place towards a breakout above 14131. A breaking the trend-line and the neckline could set not motion a decline with ~13450 as the first level of support to watch, followed by ~13037/March trend-line.

DAX Daily Chart (holding on trend-line)
DAX Hourly Chart (H&S possibility)
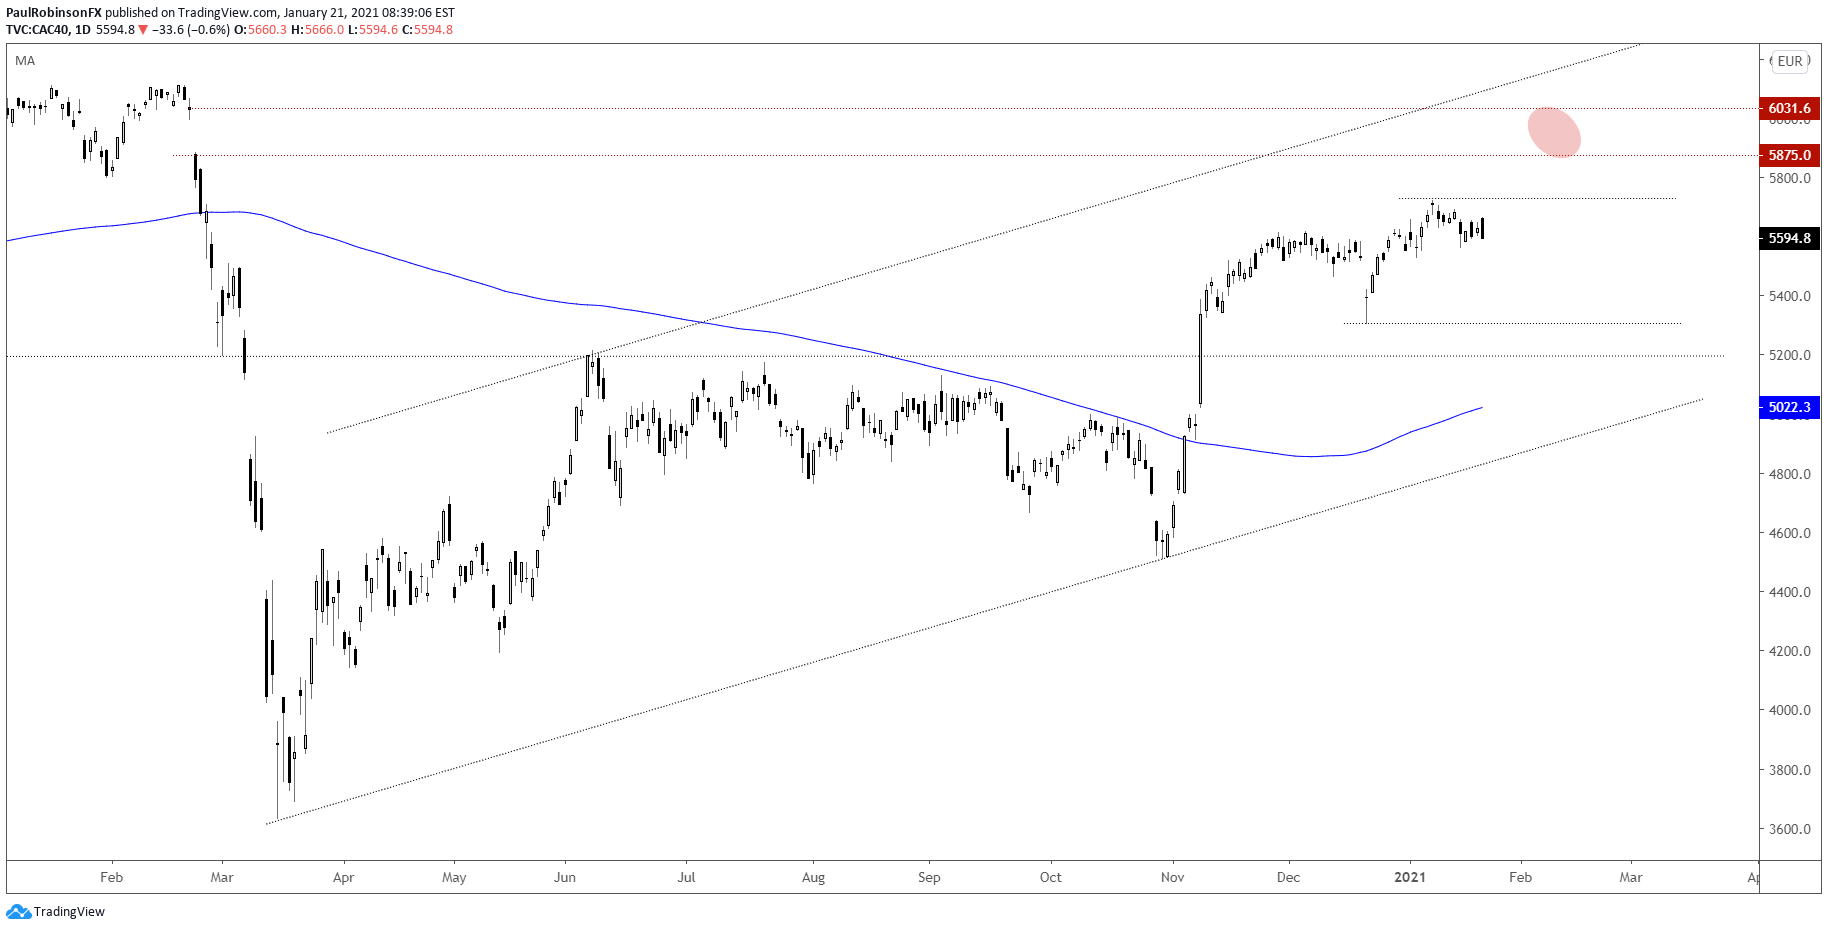
The CAC is following a similar path as the DAX, of course, but with some minor differences. It has the same short-term head-and-shoulders pattern, but lacks the trend-line from the end of October. This doesn’t mean it isn’t supported, just that it has one less technical signpost to watch.
A breakdown in price may develop in sync with the DAX, but a clean level of support doesn’t exist until the December 21 low at 5306. Then beneath there is some long-term support around 5200.
On the top-side, a breakout above 5721 could set into motion a filling of the coronavirus-induced gap produced eleven months ago. The gap exists from 5875 up to 6031.
CAC Daily Chart (moving sideways)
Resources for Forex Traders
Whether you are a new or experienced trader, we have several resources available to help you; indicator for tracking trader sentiment, quarterly trading forecasts, analytical and educational webinars held daily, trading guides to help you improve trading performance, and one specifically for those who are new to forex.
---Written by Paul Robinson, Market Analyst
You can follow Paul on Twitter at @PaulRobinsonFX


