


DAX/CAC Technical Outlook:
The DAX is getting beat up to the tune of 2% at the time of this writing, with a large portion of the losses attributed to SAP losing nearly 20% of its value in today’s trade on earnings. This down-move in the index is putting significant support to the test.
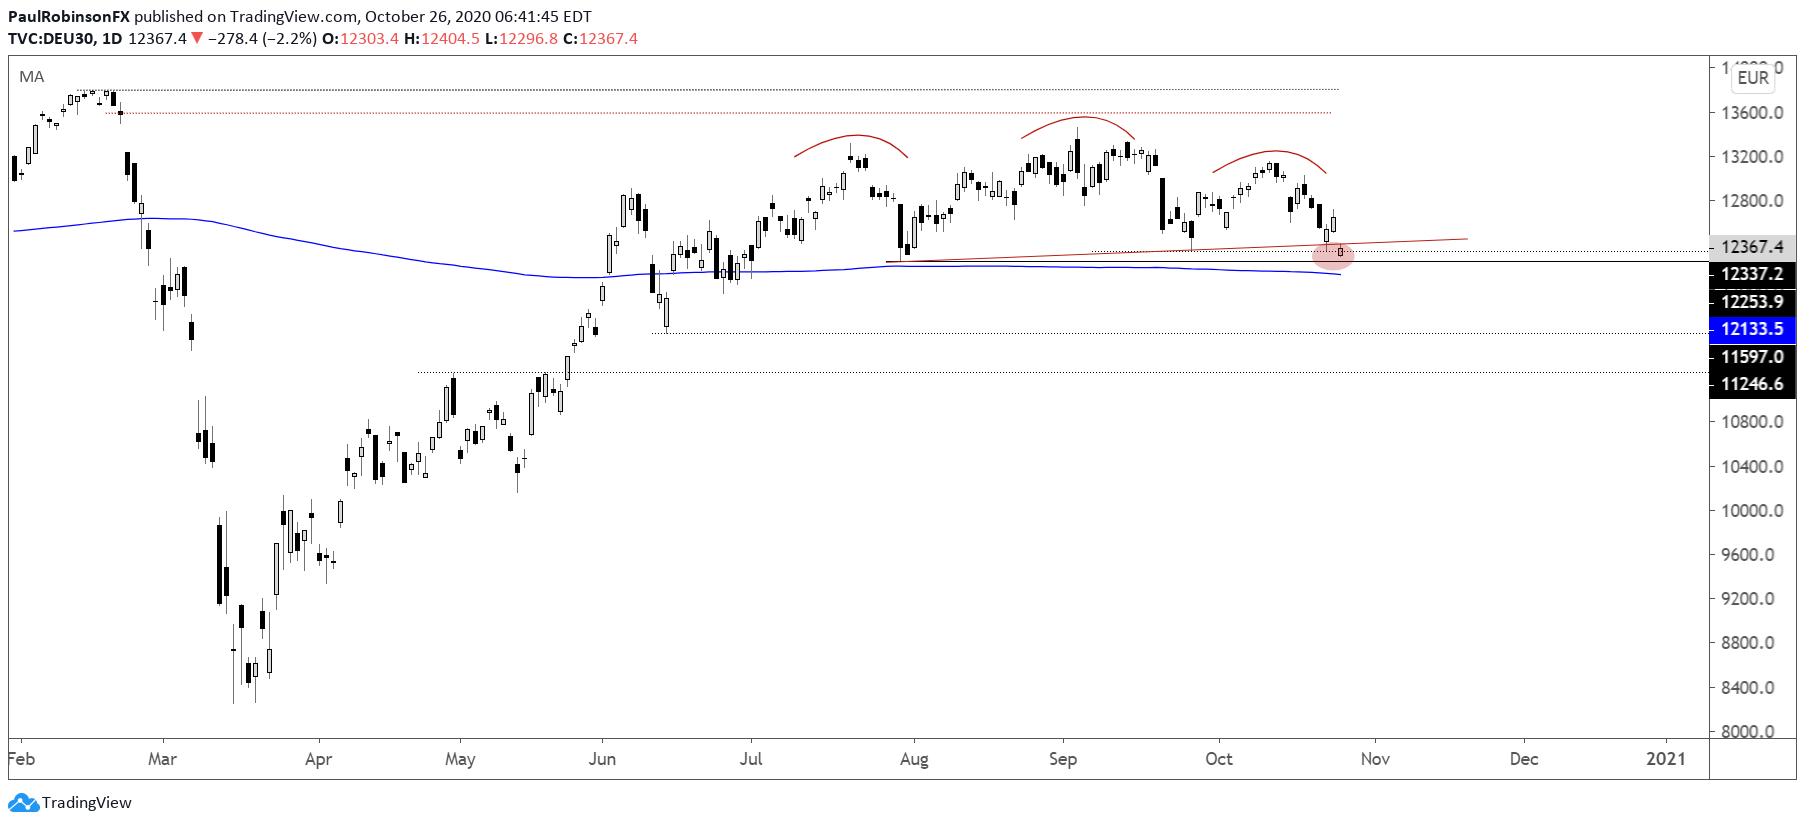
In recent weeks we have been discussing the possibility of a head-and-shoulders (H&S) pattern, and with a little more weakness it will have fully completed and validated it by having price fall through the neckline.
The DAX is currently trading right around the neckline and just above the July low and 200-day moving average. A decline below both the neckline and the 200-day at 12133 should have the DAX rolling downhill.
But to get bearish momentum really cranked up, we will likely need the leading U.S. stock market to roll over too before we get full risk-off in financial markets. The height of the H&S formation implies the DAX could move to 11k, or worse.
Again, though, before getting too bearish we need to see the neckline and 200-day break, otherwise we may see it hold and continue to push the DAX further into a trading range. So while the H&S pattern is very near completion it isn’t a valid pattern until it triggers, a fact that gets lost on many when looking at these patterns. Support is support until it isn’t.

DAX 30 Daily Chart (Support being challenged)
The CAC outlook isn’t as clear as it is with the DAX, having been stuck in a range for many months. In the big picture it is certainly much weaker than many other major global markets as it has yet to come near the year highs made before the coronavirus knocked markets over.
The big level on the downside is just under 4700. The level dates back to the April high, where thereafter resistance then became support in June and September. Stay above and the range continues, break below and it appears likely it would be following the DAX as it too likely breaks its own major level of support.
CAC 40 Daily Chart (continue to watch support just below 4700)

Forex Trader Resources
Whether you are a new or experienced trader, we have several resources available to help you; indicator for tracking trader sentiment, quarterly trading forecasts, analytical and educational webinars held daily, trading guides to help you improve trading performance, and one specifically for those who are new to forex.
---Written by Paul Robinson, Market Analyst
You can follow Paul on Twitter at @PaulRobinsonFX


