


DAX 30/CAC 40 Technical Highlights
To see our intermediate fundamental and technical outlook for the DAX & Euro, check out the DailyFX Q1 Forecasts.
DAX at neckline, trend-line resistance
The DAX is currently trading at resistance by way of the neckline from the head-and-shoulders pattern triggered during Q4, which by itself is a big spot, but add in the confluent trend-line from June and you have the market at a big spot of resistance.
This area should have the DAX weakening here soon despite a small recapture of the 2011 trend-line. With the trend-line extending back as far as it does, a stronger push above will be needed to consider it a true recapturing of the long-term threshold.
Throw into the mix the fact that the S&P 500 is trading at a big level of resistance and the case for weakness gets even stronger. Yesterday, I discussed how the U.S. indices have big levels to contend with and even if they only turn out to enough to induce a minor pullback, this should have the trading bias in the near-term focused on shorts in major global markets.
DAX Weekly Chart (H&S neckline)

DAX Daily Chart (t-line, neckline)

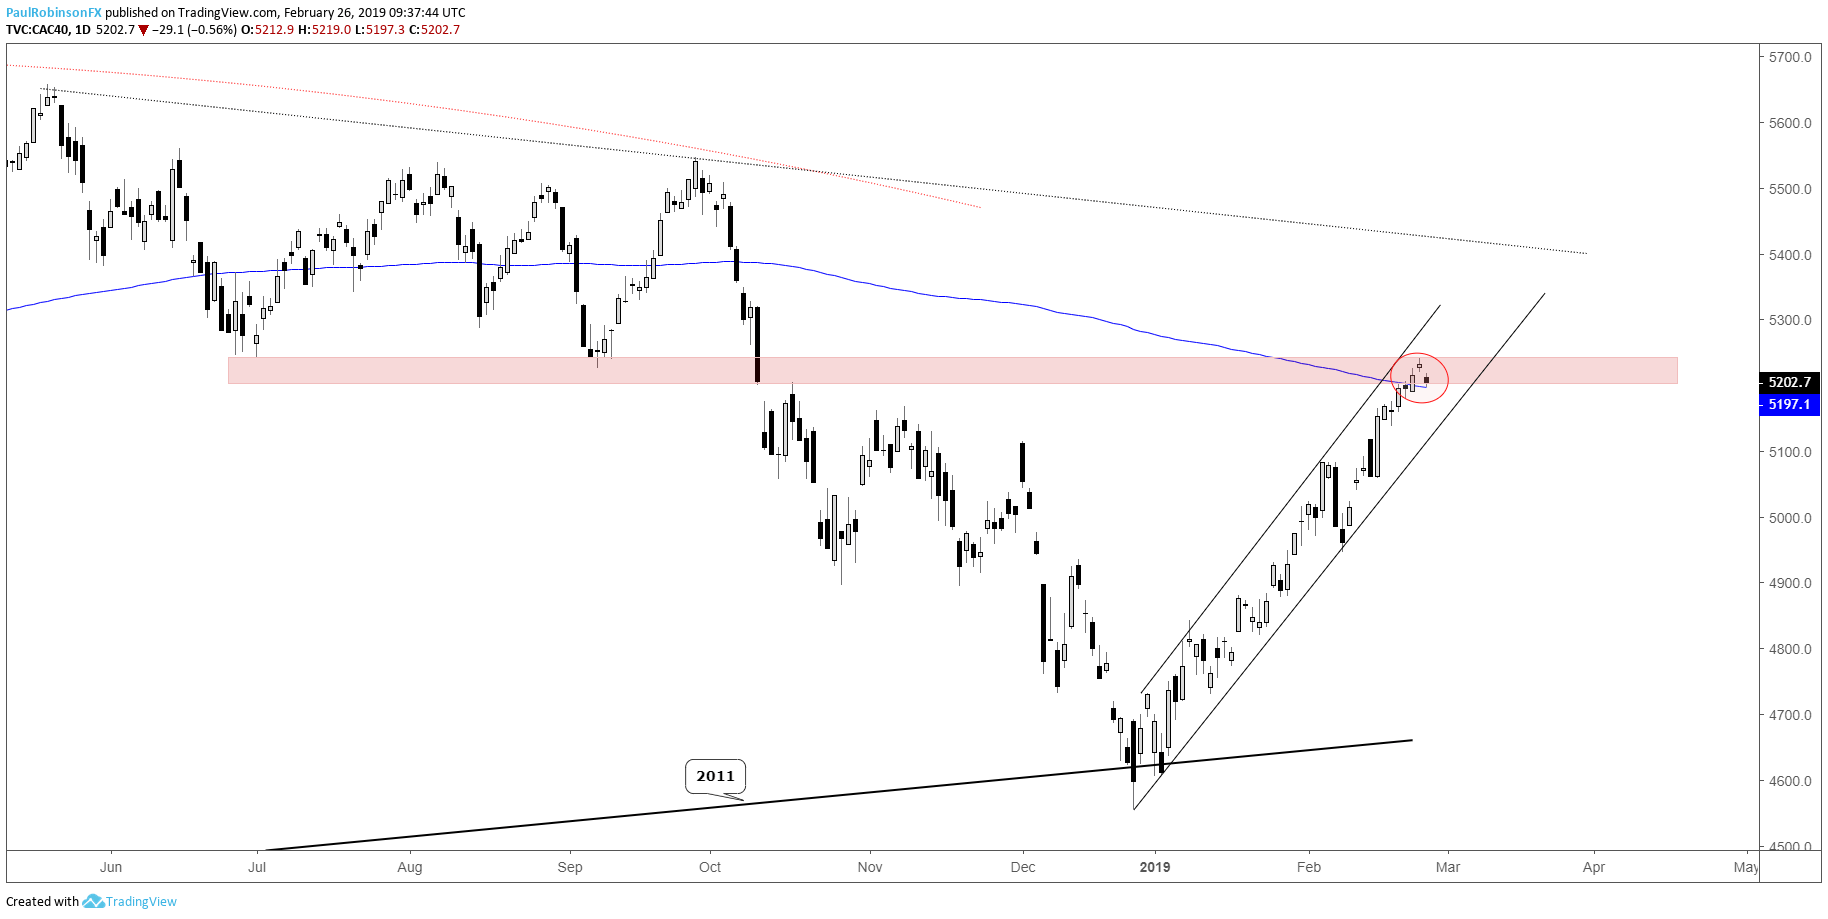
CAC at price resistance, shade above 200-day
The French index is pressed firmly up against lows from June and September, hanging out around the 200-day MA. The steep rise off the low looks to be in need a breather at the least, and with a turn down and break of the clean channel structure off the December low, we should see just that. Given the significance of levels and relative strength differences the DAX remains the preferred short, however.
CAC Daily Chart (solid resistance)
Want to learn more about trading the DAX? Check out ‘How to Trade the DAX’, and join me weekly for technical updates in the Indices and Commodities webinar.
Forex & CFD Trader Resources
Whether you are a new or experienced trader, we have several resources available to help you; indicator for tracking trader sentiment, quarterly trading forecasts, analytical and educational webinars held daily, trading guides to help you improve trading performance, and one specifically for those who are new to forex.
---Written by Paul Robinson, Market Analyst
You can follow Paul on Twitter at @PaulRobinsonFX


