


S&P 500/Dow Jones/Nasdaq 100 Technical Highlights:
- S&P 500 just beneath 2800/17 zone, big resistance
- Dow Jones in the 26k vicinity, watch integrity of channel
- Nasdaq 100 small range suggests movement coming
Check out the forecasts for Global Stock Indices and other markets on the Trading Guides page.
S&P 500 just beneath 2800/17 zone, big resistance
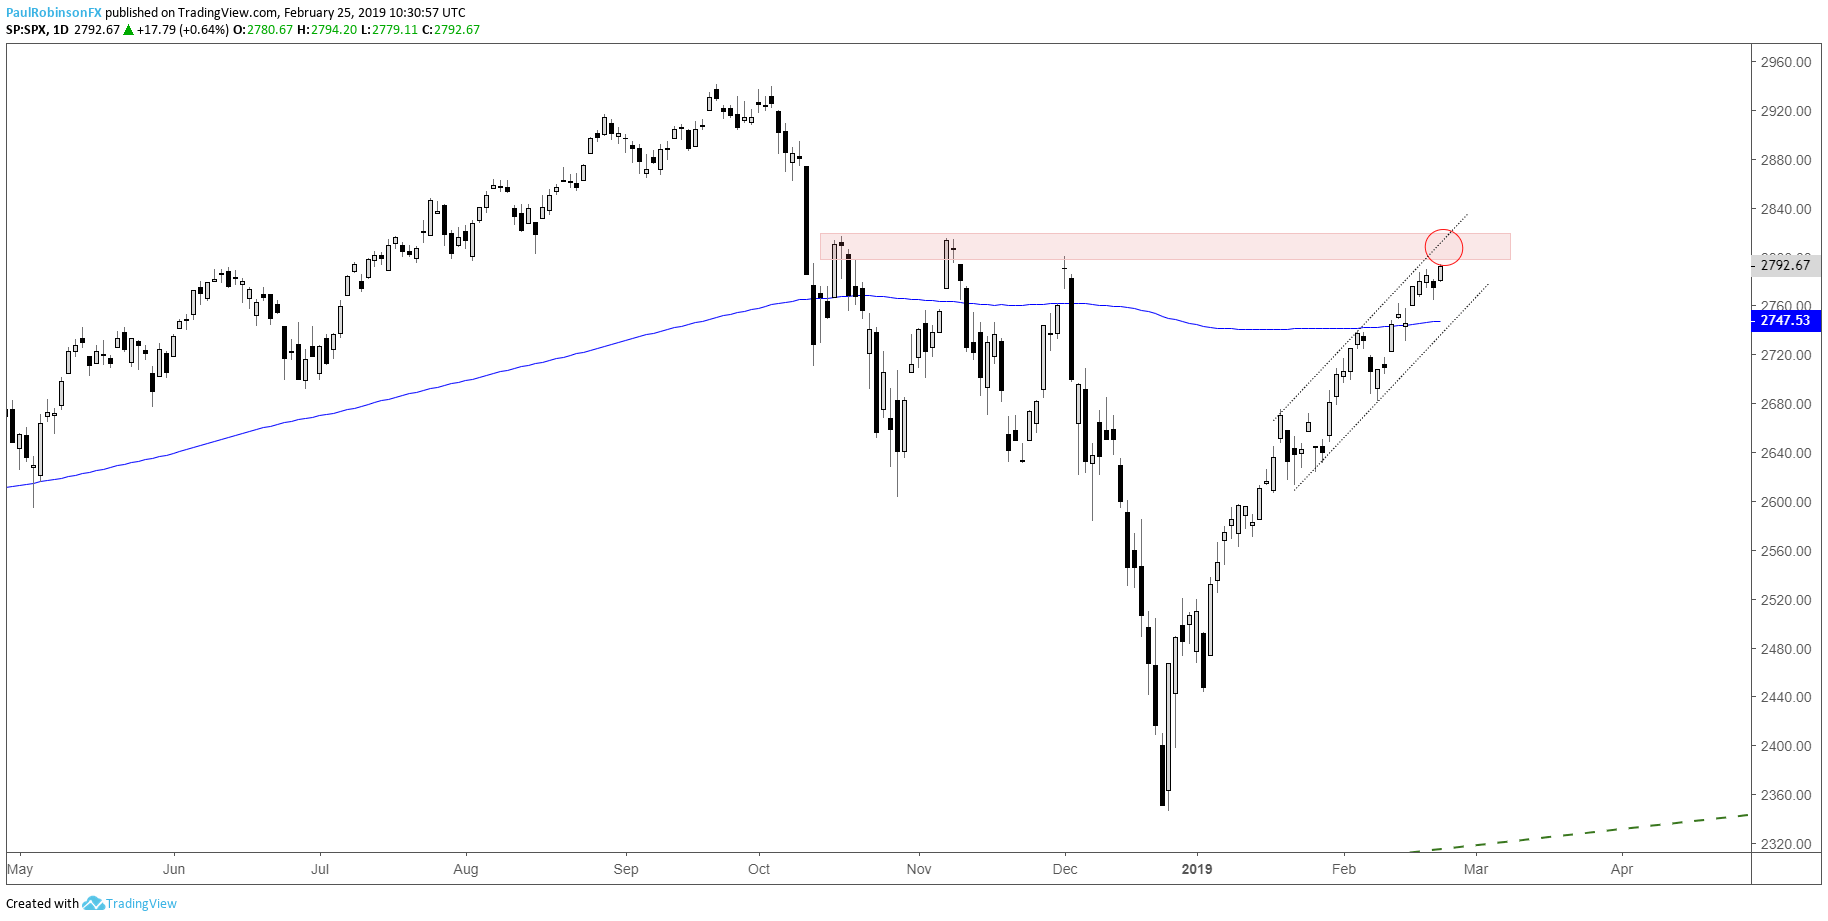
The S&P 500 is quickly approaching significant resistance via the 2800/17 zone consisting of peaks created late last year prior to the December swoon. At the time of this writing, futures are indicating a thorough test of resistance will begin this morning, making the next few days an important set of sessions.
Price action around important levels is important to watch as it can indicate the markets intentions. An upstart in volatility and selling from important levels will put the 5-week channel structure at risk of breaking, and with it bring the possibility of a meaningful retracement or worse.
On the flip side, if the current price behavior continues (maintain low volatility inside the channel) or the market begins to accelerate upwards above 2817, then it may not take long before a test of record highs develops. The higher likelihood scenario appears to be for a pullback to unfold first, even if the recent march is for new record levels.
Stocks are rallying, but will it last in the long-term? Find out where our analysts see stocks headed in the Global Equities Forecast.
S&P 500 Daily Chart (About to test strong resistance)
Dow Jones in the 26k vicinity, watch integrity of channel
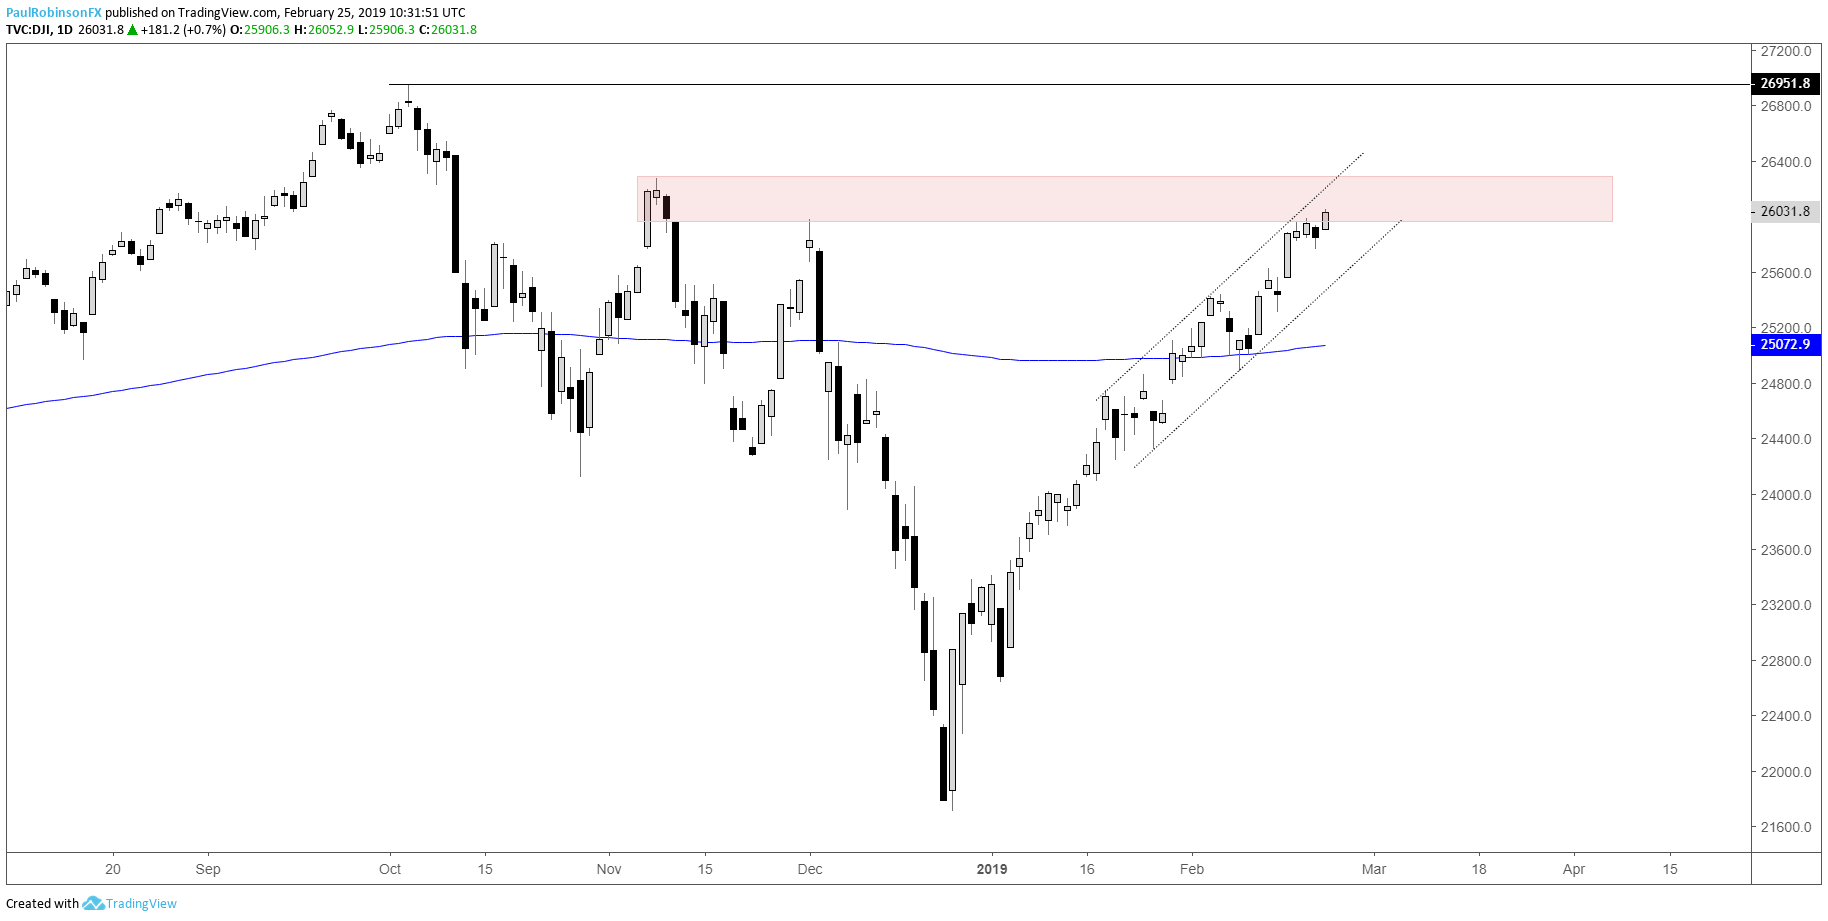
The Dow broke above 25980 on Friday and is staring down the November peak at 26277. It also has the top-side of a 5-week channel to compete with as well, a structure which like the S&P 500 will need to be broken at some point if price is to move into reverse. For now, playing off the SPX, with the Dow as the stronger index and the Nasdaq 100 as the weaker…
Dow Daily Chart (26k-ish resistance met)
Nasdaq 100 small range suggests movement coming
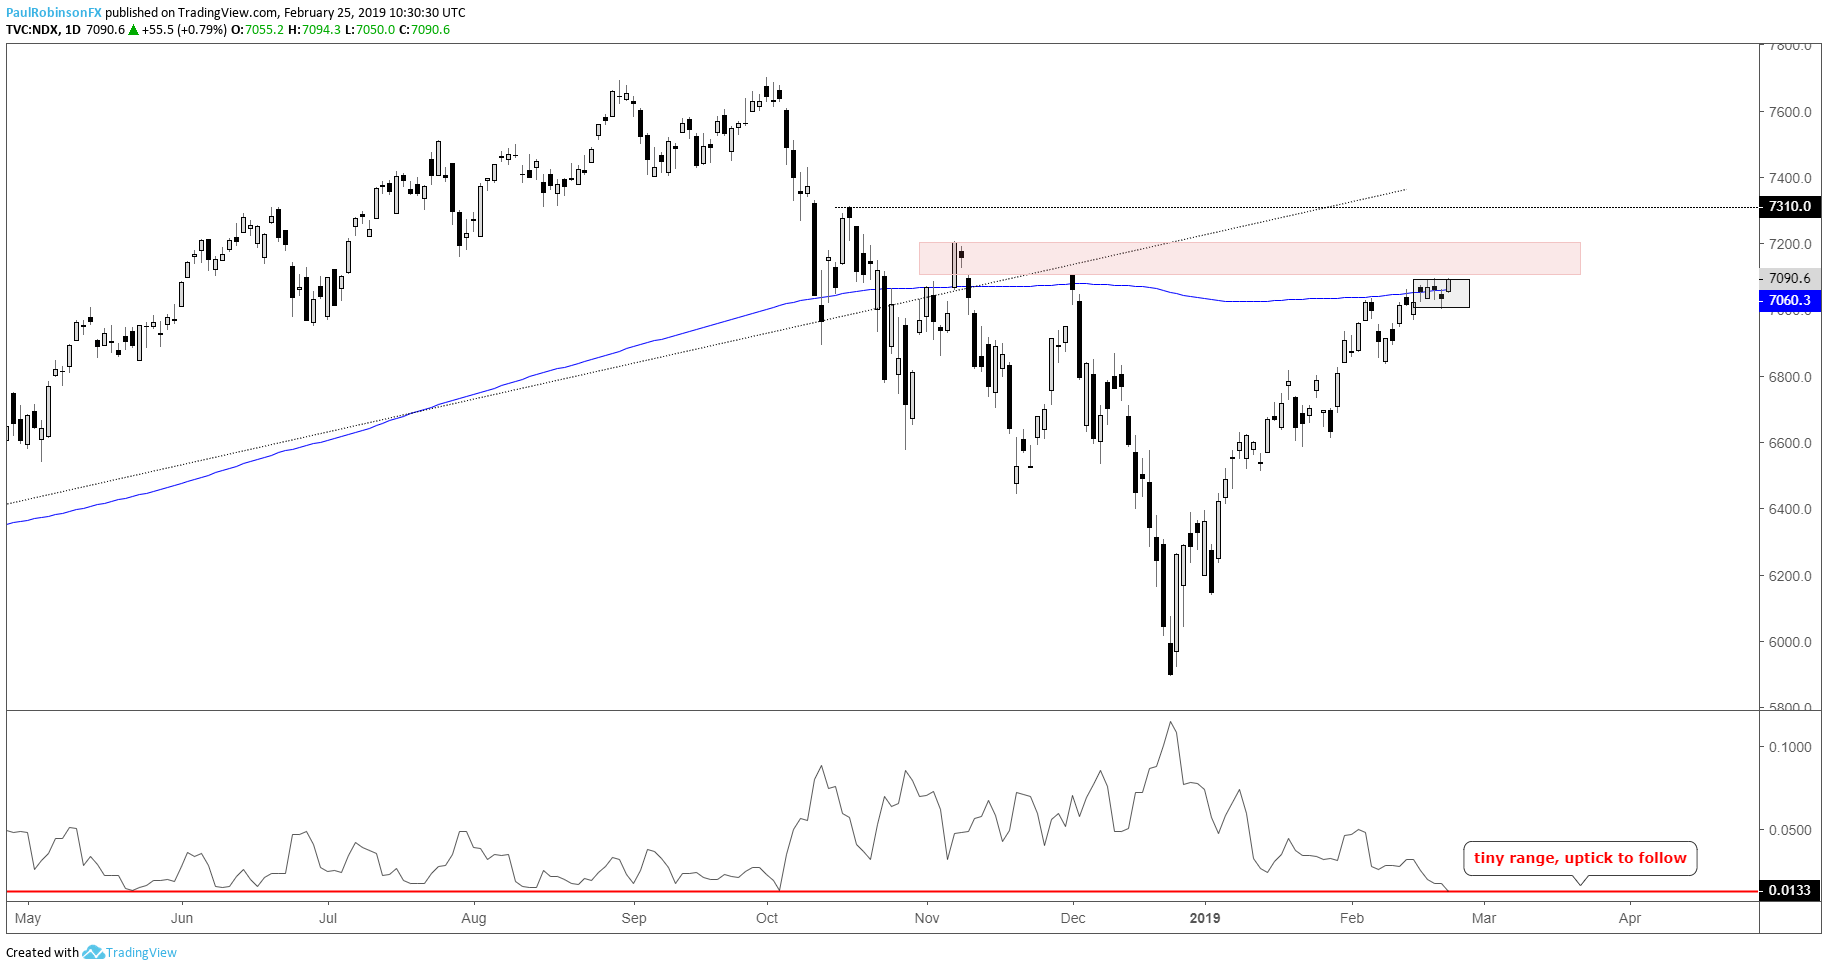
The Nasdaq 100 has been a bit more sluggish recently, with last week’s trading range marking one of the smallest of the past couple of years. This won’t last and suggests we will likely see an uptick in price swings very soon. There are the similar peaks in the area just as there are with the S&P and Dow, along with the 200-day running right through the narrow range. A pop higher out of congestion and reverse could be a sign things are turning around and a welcomed uptick in volatility is underway.
Nasdaq 100 Daily Chart (Small range to lead to bigger moves)
To learn more about U.S. indices, check out “The Difference between Dow, Nasdaq, and S&P 500: Major Facts & Opportunities.” You can join me every Wednesday at 10 GMT for live analysis on equity indices and commodities, and for the remaining roster of live events, check out the webinar calendar.
Tools for Forex & CFD Traders
Whether you are a beginning or experienced trader, DailyFX has several resources available to help you; indicator for tracking trader sentiment, quarterly trading forecasts, analytical and educational webinars held daily, trading guides to help you improve trading performance, and one specifically for those who are new to forex.
---Written by Paul Robinson, Market Analyst
You can follow Paul on Twitter at @PaulRobinsonFX


