


To receive James Stanley’s Analysis directly via email, please sign up here.
Talking Points:
- The Bank of England voted 6-2 to hold rates flat at today’s rate decision, and the dovish outlook brought to markets helped to soften GBP/USD down to a key support level.
- Current support is showing around the 38.2% retracement of the ‘Brexit move’ in GBP/USD.
- If you’re looking for trading ideas, check out our Trading Guides. They’re free and updated for Q1, 2017. If you’re looking for ideas more short-term in nature, please check out our IG Client Sentiment.
In our last article, we looked at the British Pound after the pair traded above the vaulted 1.3000 level to set a fresh 2017 high. Over the previous month, there had been starts and stops for the bullish move in the pair, and that seemingly started in June shortly after the Bank of England had surprised markets with three votes dissenting in favor of rate hikes. Those three votes for a rate hike were the most since 2011 at the MPC, and this triggered fresh fears of the BoE’s massive stimulus program wreaking dire consequences on the British economy. After the ‘sharp repricing’ in the value of GBP around Brexit and then the ensuing dovish campaign from the BoE, higher levels of inflation seemed simply mathematical as importers moved prices-higher to adjust for the -20% move-lower in GBP/USD.
As those levels of inflation began to creep-higher earlier in the year, the thought that the BoE may need to adjust rates to stem those inflationary forces began to gain steam. In March, Kristin Forbes became the first vote for a rate hike at the BoE since Brexit, and she even accompanied that vote with an op-ed in The Telegraph to explain the rationale behind her decision. Then in June, inflation for the month of May came in at 2.9%; followed by those three dissenting votes that helped to bring some life in GBP/USD. When Mark Carney himself opined on the matter towards the end of the month, saying that rate hikes may be on the horizon for the U.K., the British Pound shot-higher to trade through the 1.3000 level.
After a pullback was seen through the first two weeks of July, USD-weakness began to take over, and GBP/USD went into resumption of the bullish move after a 50% retracement, extending all the way up to fresh 2017 highs at 1.3269.
GBP/USD Daily: Bullish Trend Resumption Drives to Fresh 2017 Highs

Chart prepared by James Stanley
As we came into this morning’s Super Thursday batch of announcements out of the BoE, the British Pound remained strong. The potential implication of a more-hawkish BoE did not appear to be lost on markets, but as the bank took yet another dovish tilt in their forward-looking outlooks, the British Pound feel-back to a key support level against the U.S. Dollar. The level of 1.3116 is the 38.2% Fibonacci retracement of the ‘Brexit move’ in GBP/USD; taking the pre-Brexit high of 1.5006 down to the ‘adjusted low’ after the flash crash at the price of 1.1950.
GBP/USD Daily: Old Resistance, New Support at the 38.2% Retracement of the ‘Brexit Move’

Chart prepared by James Stanley
At this stage, the up-trend in GBP/USD is facing a pullback that isn’t quite 23.6% of the bullish move that began in mid-June. This helps to put in perspective just how shallow this recent drop is relative to the ‘bigger picture’ in Cable, and this highlights the fact that we may have a deeper pullback in the pair before bulls are ready to take-over. The 1.3000 area remains attractive for near-term price action plays, as this psychological level is confluent with the 38.2% Fibonacci retracement that’s just eight pips above; and if support can show here, top side plays can be attractive under the presumption of bullish trend continuation.
A pivotal Non-Farm Payrolls report on the docket for tomorrow can change matters considerably: The U.S. Dollar remains extremely weak, and this has certainly played a role in the bullish move in Cable since mid-June. As the U.S. Dollar gets more and more oversold, the potential for a short-squeeze in the Greenback runs-higher, and this can help to produce that deeper pullback in Cable before ‘big picture’ long positions become attractive again.
GBP/USD Four-Hour: Support Potential at 23.6 and 38.2% Fibonacci Retracements
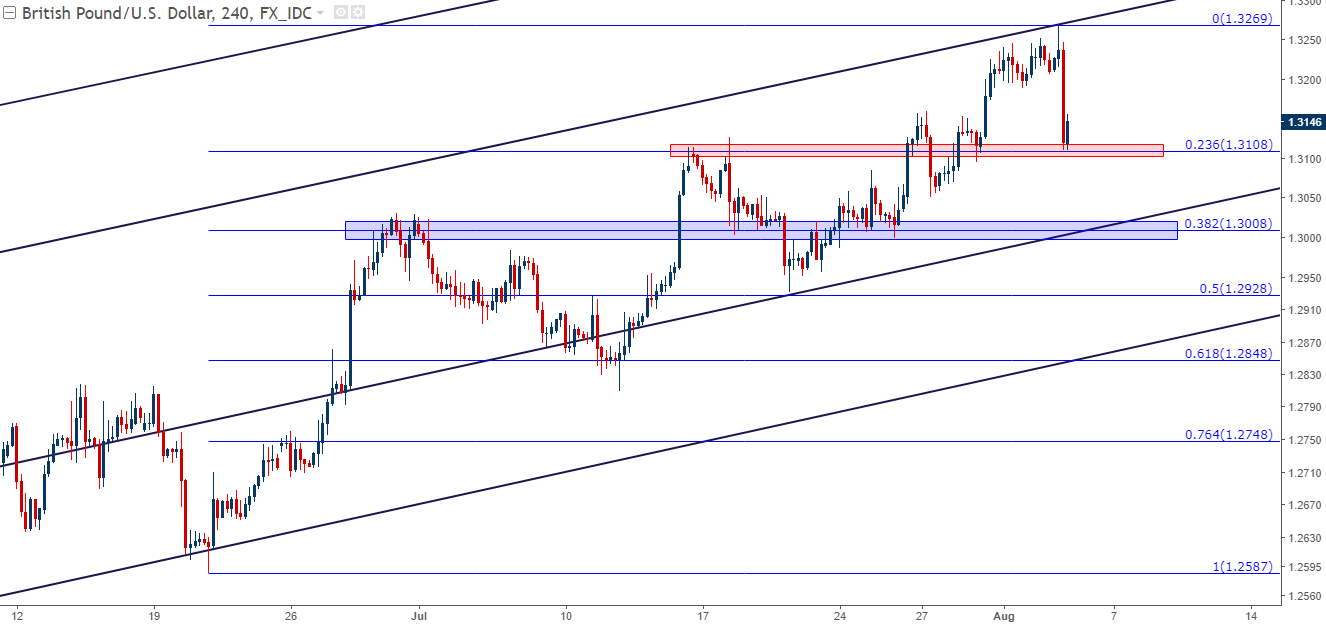
Chart prepared by James Stanley
--- Written by James Stanley, Strategist for DailyFX.com
To receive James Stanley’s analysis directly via email, please SIGN UP HERE
Contact and follow James on Twitter: @JStanleyFX


