


Dow Jones Industrial Average has been flying high lately. DJIA will meet its next obstacle on Wednesday, the Fed. FOMC meets to discuss their latest round of monetary policy. An aggressive balance sheet reduction plan may create jitters among traders as the proverbial punch bowl of monetary easing is emptied.
(Join my colleague John for a live webinar as FOMC releases their statement Wednesday.)
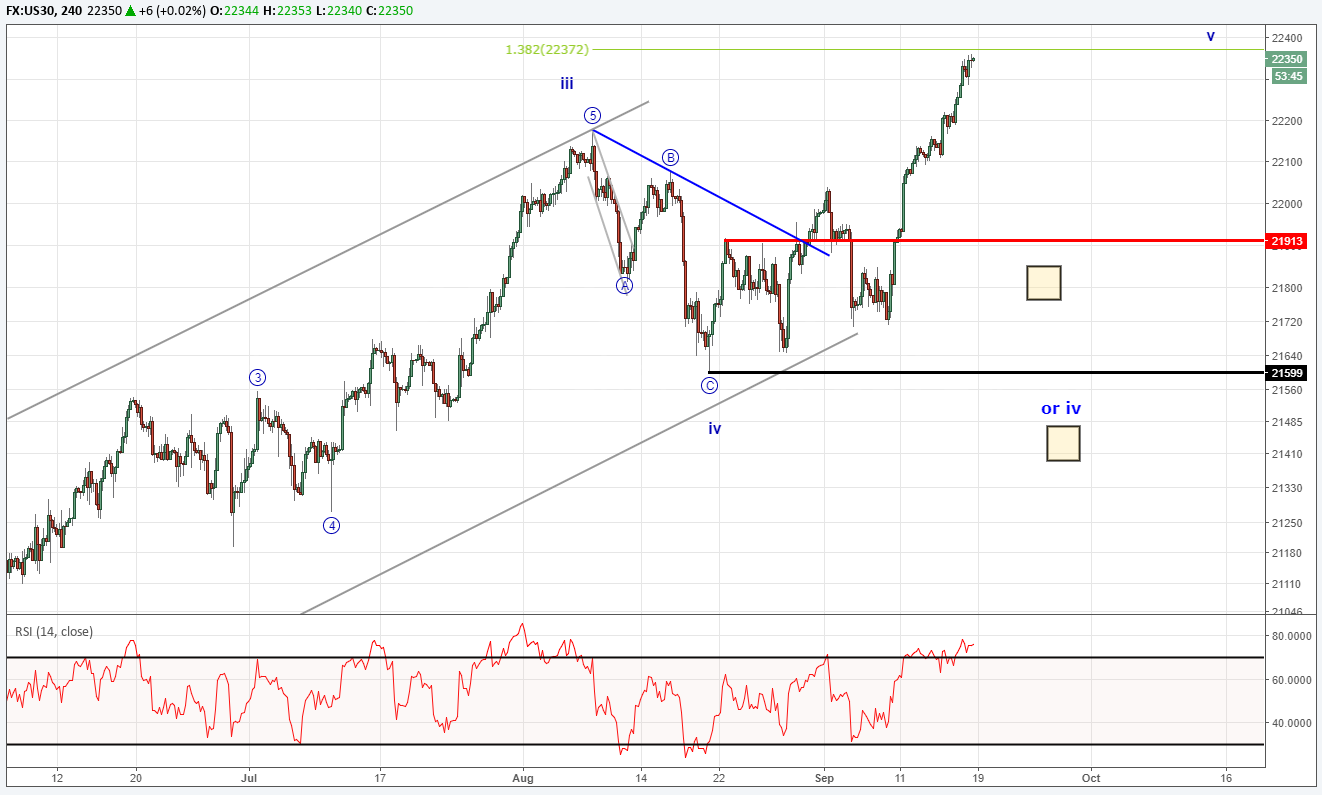
The technical pattern for DJIA has a couple of main options available. If DJIA can break and hold above 22,372 (where the 1.382 expansion is), then there is an immediate bullish move we are anticipating. There is an immediate bearish option that calls for DJIA to pivot now and return lower towards 21,800.
The bearish option would be an expanded flat pattern or triangle pattern where DJIA is currently within the ‘b’ wave of the pattern. This implies another correction lower in wave ‘c’. If the expanded flat pattern plays out, then price may dig towards 21,400-21,800. A ‘c’ wave of a triangle would hold above 21,600 and continue to grind sideways.
Both the expanded flat and triangle imply the same thing. That is to say that once those patterns complete, we anticipate DJIA to break to new highs in a final terminal wave.
A breakdown below 21,200 would cause us to stand back and reconsider the wave pattern. We have been in a long bull run since 2009 with minimal corrections along the way. DJIA trend is quite mature so have an exit plan ready before you enter. Read other traits we found of successful traders here.
Want to learn more about Elliott Wave analysis? Grab the Beginner and Advanced Elliott Wave guides.
DJIA Elliott Wave Chart
---Written by Jeremy Wagner, CEWA-M
Discuss this market with Jeremy in Monday’s US Opening Bell webinar.
Follow on twitter @JWagnerFXTrader .
Join Jeremy’s distribution list.
Recent Elliott Wave articles by Jeremy:
USDJPY Advance May Kick Off a New Uptrend


