


New Zealand Dollar Analysis, GBP/NZD, NZD/CHF, NZD/JPY – TALKING POINTS
- GBP/NZD may retest a familiar stalling point: what will happen then?
- NZD/CHF could capitulate as it climbs towards December resistance
- NZD/JPY is in a compression zone but upside potential may be limited
GBP/NZD OUTLOOK
GBP/NZD is climbing along what appears to be a newly-formed rising support channel (red parallel lines) after it broke below the prior slope of appreciation (white-dotted line). The pair may aim to challenge resistance at 2.0961 where the pair’s upside movement stalled, subsequently catalyzing a retreat. If the ceiling holds and GBP/NZD breaks support, a correction may ensue, though selling pressure may abate at 2.0001.
GBP/NZD – Daily Chart
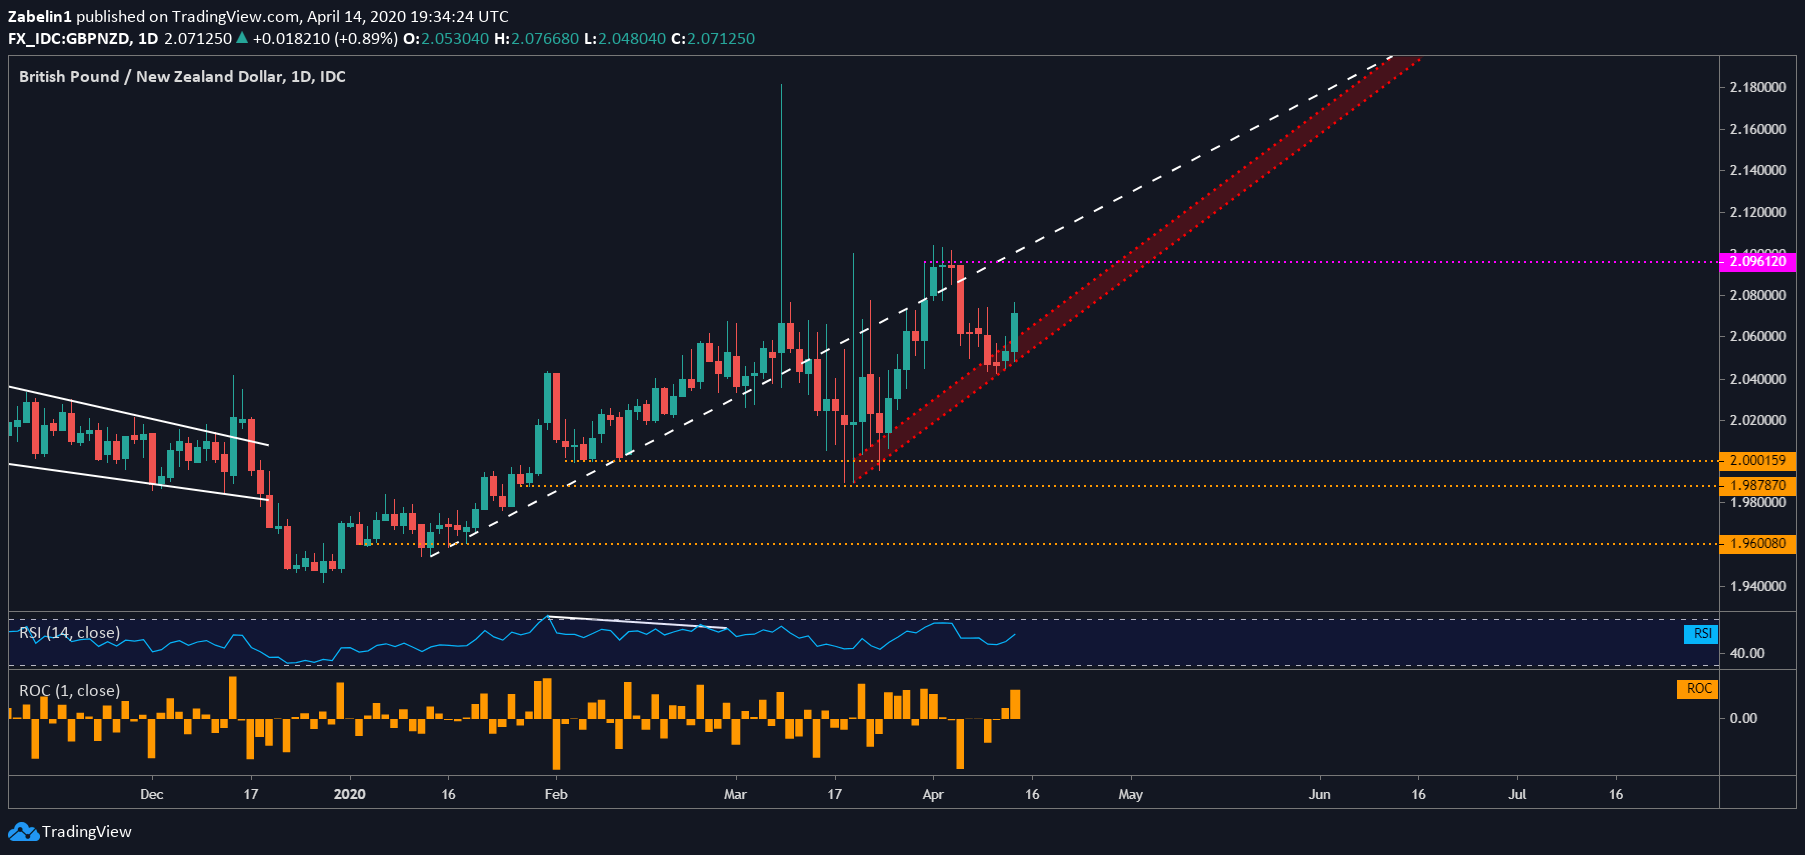
GBP/NZD chart created using TradingView
NZD/CHF FORECAST
After bottoming out at an all-time low at 0.5542, NZD/CHF rose a little over six percent and appears to have its eyes on descending resistance dating back to December 2019. If the pair is able to clear the ceiling, upside momentum may stall at a familiar inflection range between 0.6165 and 0.6223 (white parallel lines). However, if NZD/CHF is unable to puncture resistance, the pair may retreat to 0.5796 (purple-dotted line).
NZD/CHF – Daily Chart
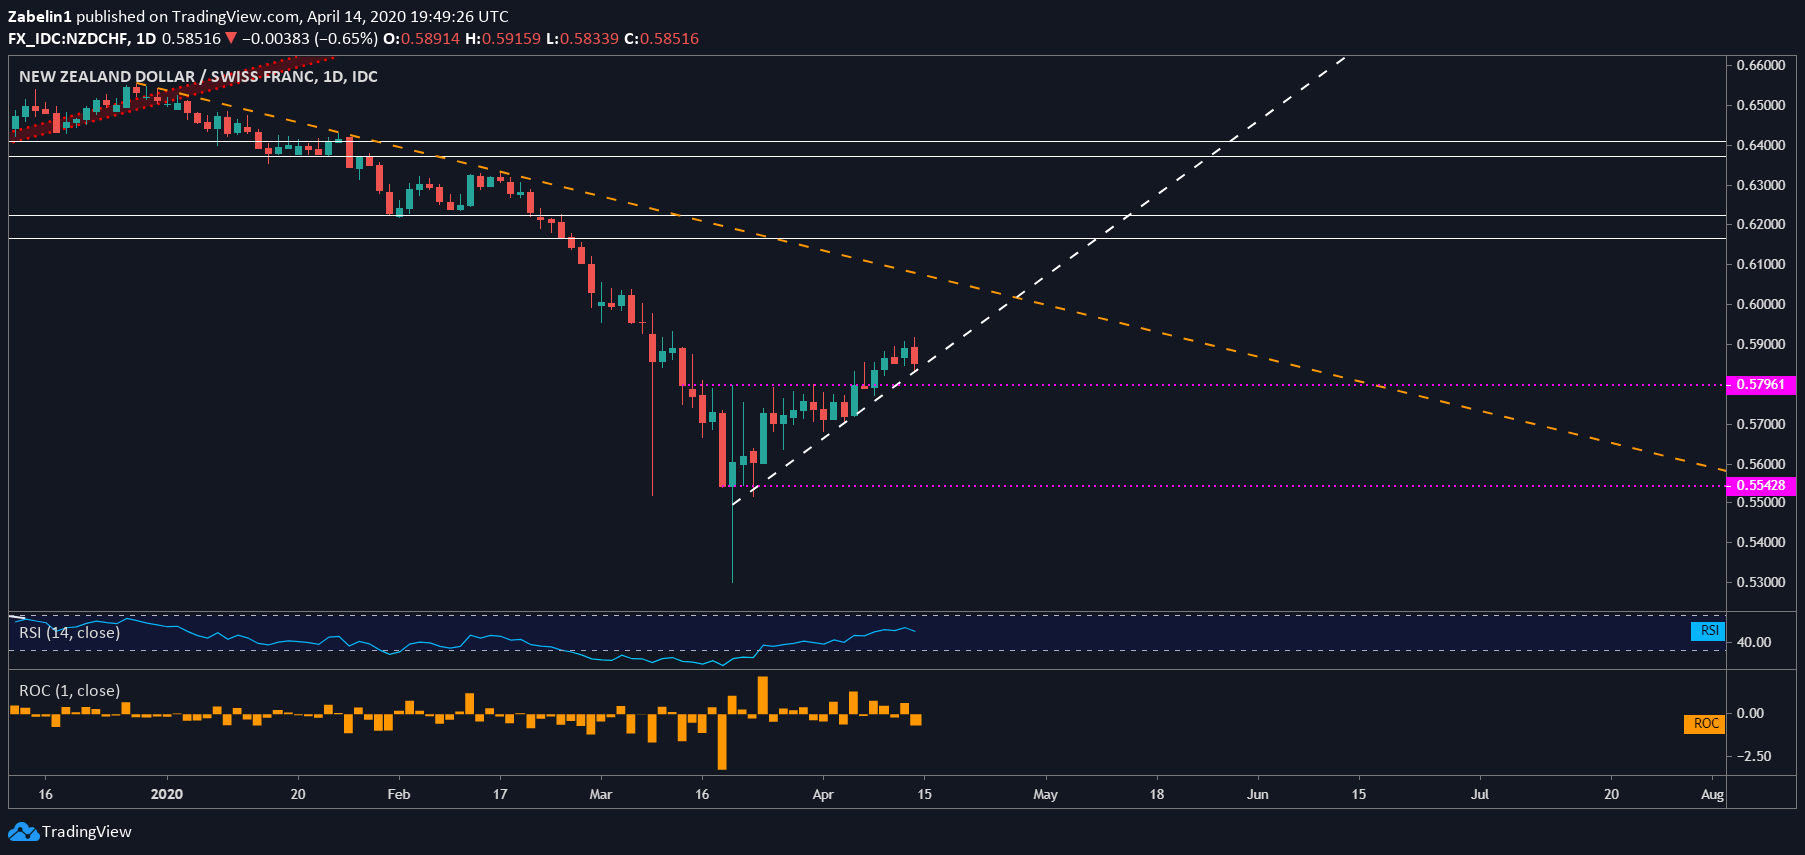
NZD/CHF chart created using TradingView
NZD/JPY ANALYSIS
NZD/JPY may soon enter a compression zone between rising support where it was born after the pair reached an all-time low at 61.974 and resistance at 67.766. If the pair breaks above the ceiling, upside gains may be capped by a formidable support-turned-resistance range between 69.897 and 70.030. However, if NZD/JPY capitulates, it may decline though selling pressure may let up at 63.304.
NZD/JPY – Daily Chart
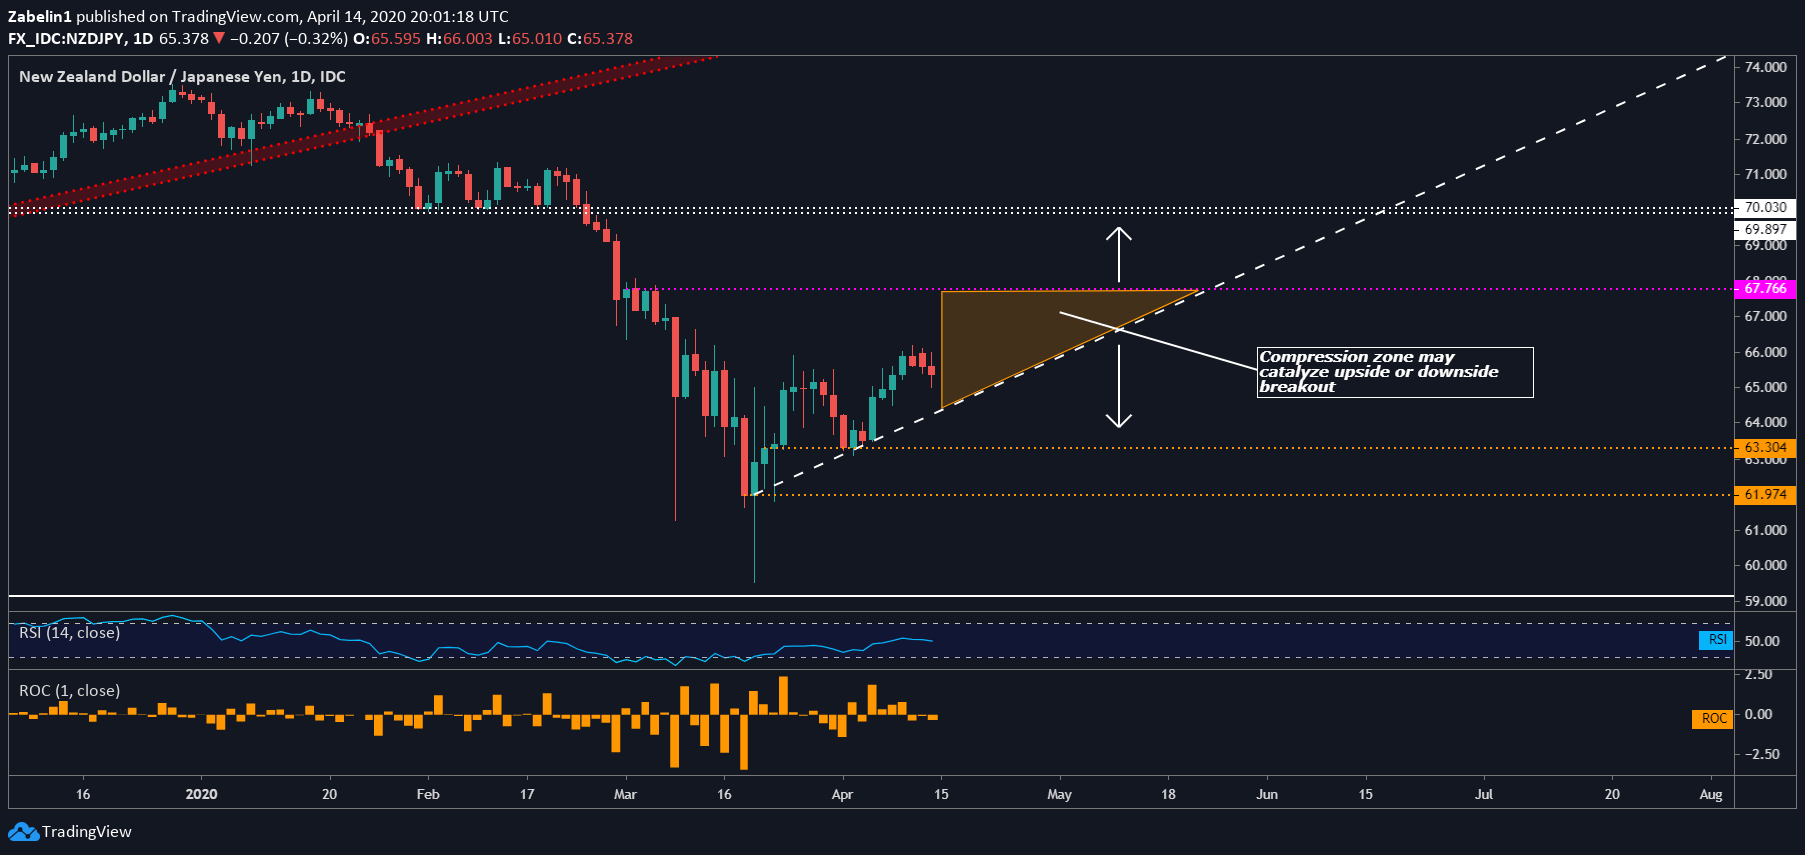
NZD/JPY chart created using TradingView
NEW ZEALAND DOLLAR TRADING RESOURCES:
- Tune into Dimitri Zabelin’s webinar outlining geopolitical risks affecting markets in the week ahead !
- New to trading? See our free trading guides here !
- Get more trading resources by DailyFX !
--- Written by Dimitri Zabelin, Currency Analyst for DailyFX.com
To contact Dimitri, use the comments section below or @ZabelinDimitri Twitter


