


US Dollar, USD/SGD, USD/IDR, USD/MYR, USD/PHP – ASEAN Technical Analysis
- US Dollar uptrend extends against ASEAN currencies on haven demand
- USD/SGD eyes 2009 levels as USD/IDR could revisit peaks from 1998
- USD/MYR facing 2015 and 2016 highs, USD/PHP breakout struggles
Singapore Dollar, Indonesian Rupiah, Malaysian Ringgit, Philippine Peso Technical Outlook
The US Dollar largely overcame fading momentum signals against ASEAN currencies such as the Singapore Dollar, Indonesian Rupiah and Malaysian Ringgit. Rather, the currency has been focusing on the fundamentals as market turmoil raises the demand for the haven-linked currency.
On the daily chart below, my ASEAN-based US Dollar index is fast approaching peaks from 2017. Rising support from the beginning of March is helping to maintain the dominant uptrend. A daily close above the 123.6% Fibonacci extension may pave the way for reaching the top from 3 years ago.

ASEAN-Based US Dollar Index – Daily Chart
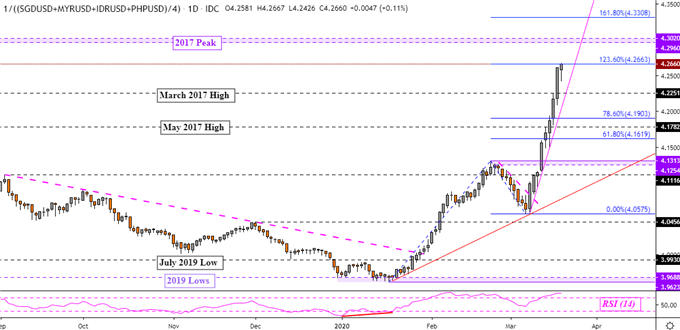
ASEAN Chart Created in TradingView
Singapore Dollar Technical Outlook
The US Dollar is nearing the 2016 high against the Singapore Dollar with momentum appearing to be in its favor. Further gains may push USD/SGD to its highest since 2009. Three levels of rising trend lines are guiding the pair higher. They are labeled “1”, “2” and “3” on the 4-hour chart below. A close under the latter may risk shifting the technical bias to the downside. Otherwise, a push through 1.4537 exposes the 61.8% Fibonacci extension at 1.4619. Above that price is the 78.6% level at 1.4716.
Learn more about how the MAS conducts monetary policy and what matters for the Singapore Dollar !
USD/SGD 4-Hour Chart
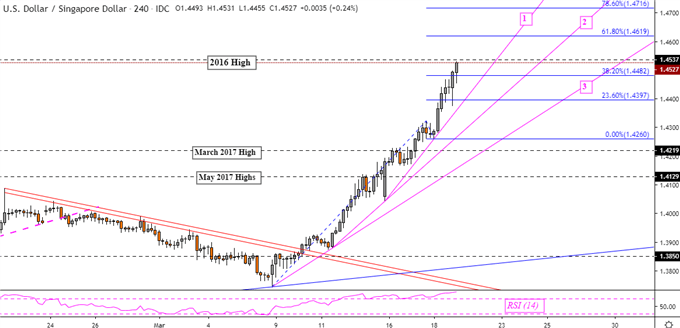
USD/SGD Chart Created in TradingView
Indonesian Rupiah Technical Outlook
The Indonesian Rupiah has weakened against the US Dollar to the cheapest point since 2018. If USD/IDR manages to surpass 15265, the Rupiah may further depreciate to the lowest it has experienced since 1998. Like with USD/SGD, there are 3 layers of rising trend lines (“1”, “2” and “3” below) maintaining the medium-term upside bias. These may guide the pair down the road towards the 138.2% and 150.0% Fibonacci extensions at 15294 and 15395 respectively.
USD/IDR Daily Chart
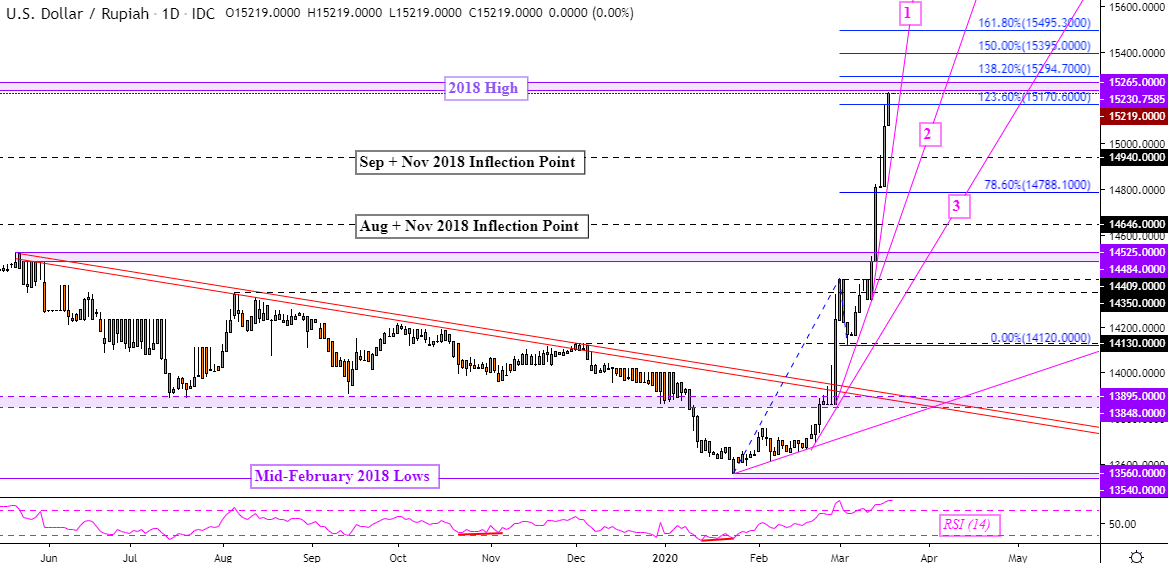
USD/IDR Chart Created in TradingView
Malaysian Ringgit Technical Outlook
USD/MYR recently took out highs from May 2017, exposing the peak from April of the same year. Rising support from the beginning of this month may maintain the dominant uptrend towards highs from 2015 and 2016. Getting there also entails closing above the 123.6% Fibonacci extensions at 4.3961 followed by the 138.2% level at 4.4240. A descent through 4.3540 may shift the focus in the interim to the downside. In the medium term, we may see “potential support” from January limit Malaysian Ringgit strength.

USD/MYR Daily Chart
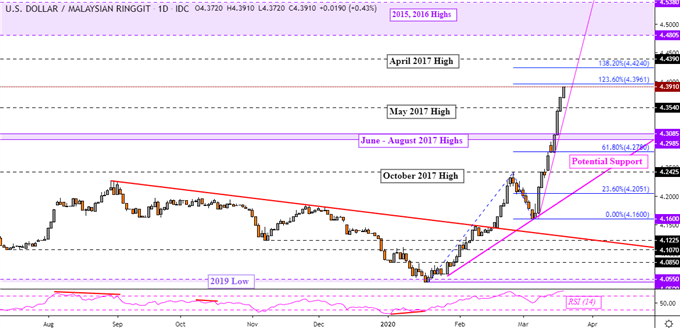
USD/MYR Chart Created in TradingView
Philippine Peso Technical Outlook
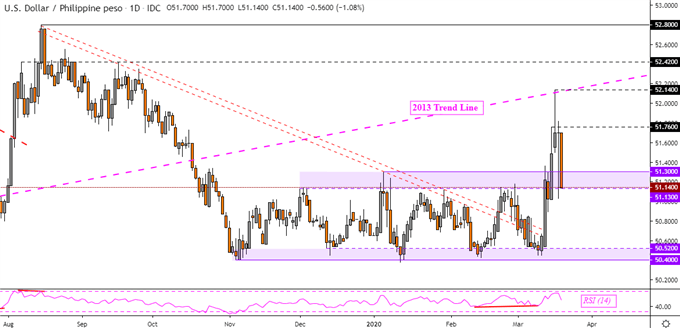
The US Dollar struggled to maintain gains against the Philippine Peso after USD/PHP pushed through 51.30. The temporary push above the latter appeared to bring an end to persistent consolidation since November. However, USD/PHP topped after revisiting the rising trend line from 2013 on the daily chart below. Prices still remain within the upper boundary of the channel. A daily close under 51.13 may pave the way to revisit key support which is a range between 50.40 to 50.52.
To stay updated on fundamental developments for ASEAN currencies, follow me on Twitter here @ddubrovskyFX
USD/PHP Daily Chart
USD/PHP Chart Created in TradingView
--- Written by Daniel Dubrovsky, Currency Analyst for DailyFX.com
To contact Daniel, use the comments section below or @ddubrovskyFX on Twitter


