


US Dollar, USD/IDR, USD/SGD, USD/MYR, USD/PHP – ASEAN Technical Analysis
- US Dollar eyeing upside breakout confirmation against ASEAN currencies
- USD/IDR and USD/MYR appear to show some signs of fading momentum
- USD/SGD extends uptrend after bullish signals, USD/PHP at range ceiling
Indonesian Rupiah, Singapore Dollar, Malaysian Ringgit, Philippine Peso Technical Outlook
The US Dollar has extended its advance against ASEAN currencies such as the Indonesian Rupiah, Singapore Dollar, Malaysian Ringgit and Philippine Peso. This follows a combination of bullish fundamental and technical signals. A global selloff in equities has rekindled demand for the haven-linked US Dollar.
Earlier this week, my ASEAN-based US Dollar index exhibited upside breakout signals and more may be ahead. There is a sign of fading upside momentum with negative RSI divergence present on the chart below. This is as my index approaches the May 2017 high which if it holds, can precede a turn lower.

ASEAN-Based US Dollar Index – Daily Chart

ASEAN Chart Created in TradingView
Indonesian Rupiah Technical Outlook
The Indonesian Rupiah continued to see selling pressure, extending losses against the US Dollar. This has left USD/IDR facing highs from May 2019 which are a range between 14484 to 14525. If taken out, that would expose 2018 highs. Guiding the pair there may be a rising support line from February (that ought to be confirmed with a third testing point). Negative RSI divergence does show fading upside momentum which may precede a turn lower. As such, if May’s peak holds, there could be a near-term decline in store ahead.
USD/IDR Daily Chart
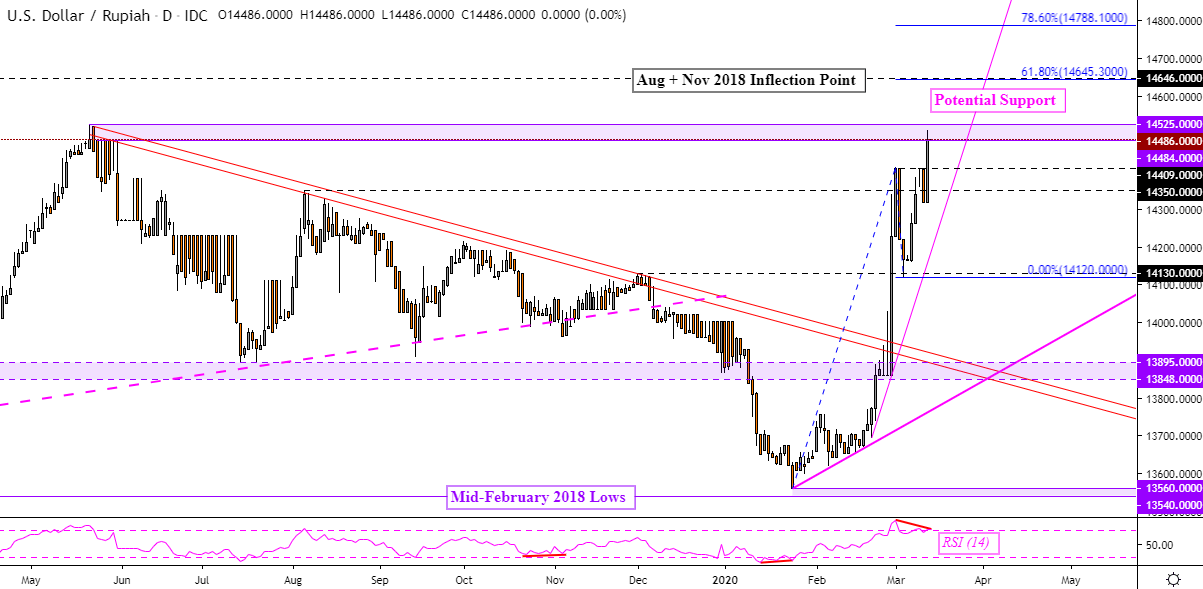
USD/IDR Chart Created in TradingView
Singapore Dollar Technical Outlook
After a Bullish Engulfing and a push through falling resistance, USD/SGD finds itself testing highs from May 2017. If taken out, that exposes the next key resistance barrier at 1.4219 which is the peak from March in the same year. Maintaining gains are multiple rising trend lines. One is from March (green line below) and a medium-term line (blue) from January. A near-term descent may place the focus on the latter should it ebb selling pressure.
Learn more about how the MAS conducts monetary policy and what matters for the Singapore Dollar !
USD/SGD Daily Chart
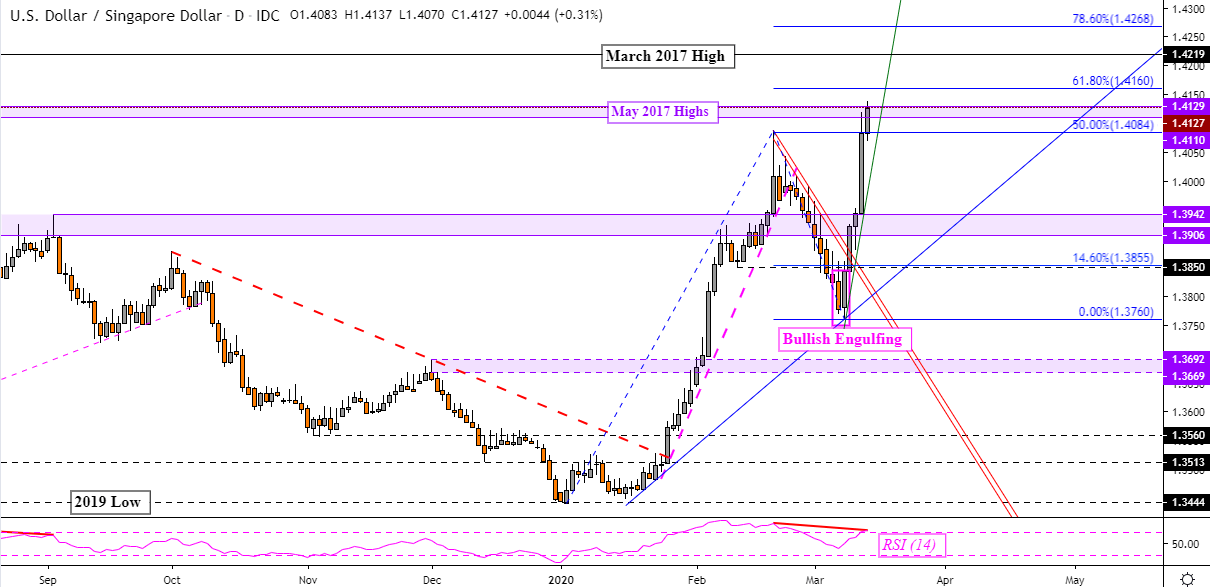
USD/SGD Chart Created in TradingView
Malaysian Ringgit Technical Outlook
The Malaysian Ringgit is depreciating, approaching its weakest point against the US Dollar from the Summer of 2017. That makes for a range of resistance between 4.2985 to 4.3085. Guiding USD/MYR to the upside is near-term rising support from this month’s low at the time of writing. Negative RSI divergence shows fading upside momentum which risks preceding a turn lower. With confirmation, that could spark a selloff towards what could be a potential rising trend line from January. Otherwise the May 2017 high may be in store next.
USD/MYR Daily Chart
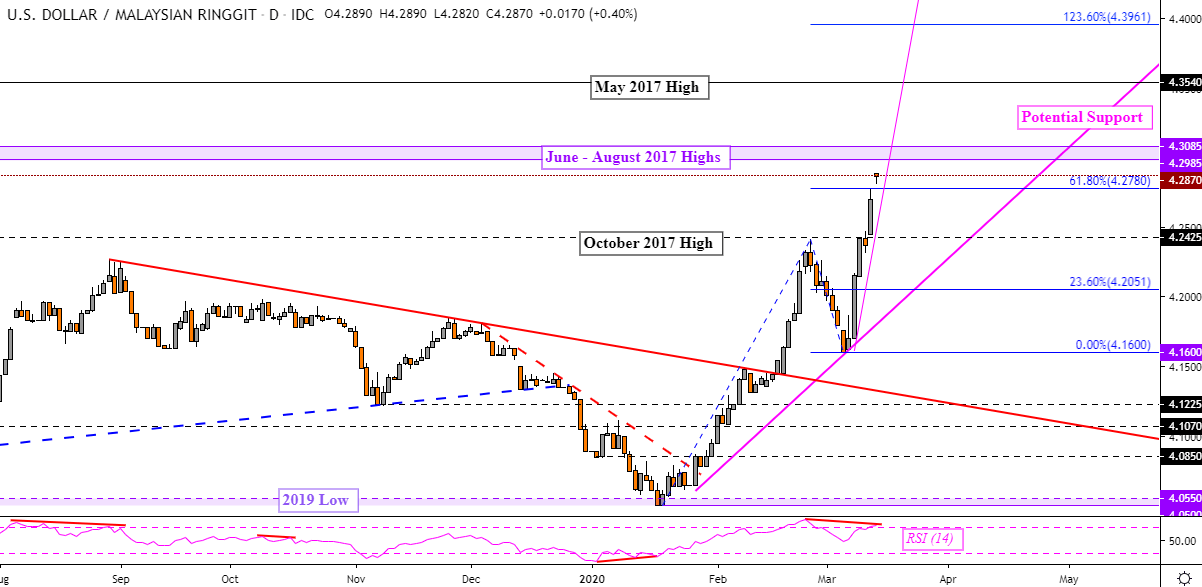
USD/MYR Chart Created in TradingView
Philippine Peso Technical Outlook
As expected, the USD/PHP is now testing the upper boundary of its congestive range since November. A close through 51.30 may pressure the Philippine Peso as the US Dollar could revisit the former rising trend line from 2013 on the chart below. Otherwise if consolidation persists, USD/PHP could be due for another visit of range bottom at 50.52 – 50.40.
To stay updated on fundamental developments for ASEAN currencies, follow me on Twitter here @ddubrovskyFX
USD/PHP Daily Chart
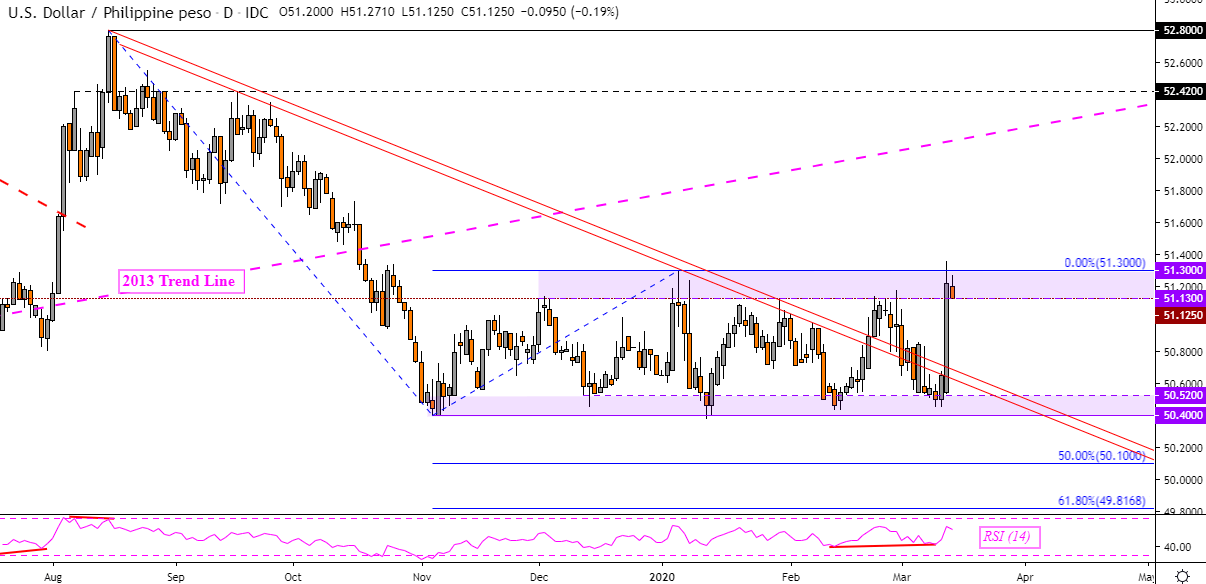
USD/PHP Chart Created in TradingView
--- Written by Daniel Dubrovsky, Currency Analyst for DailyFX.com
To contact Daniel, use the comments section below or @ddubrovskyFX on Twitter


