USD/SGD, USD/INR, USD/MYR, USD/PHP - Talking Points
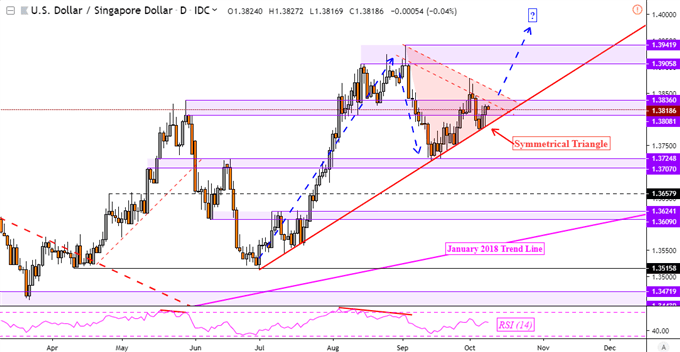
- USD/SGD may climb on symmetrical triangle
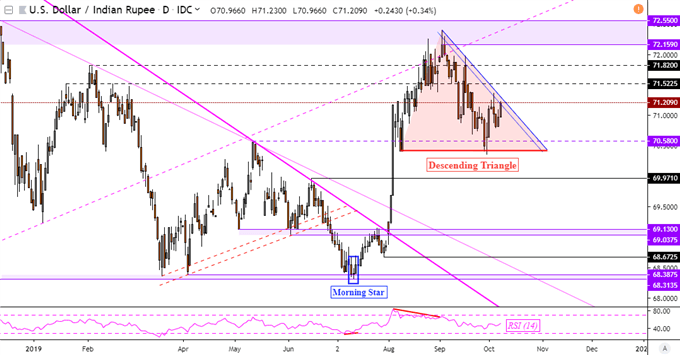
- USD/INR could decline on descending triangle
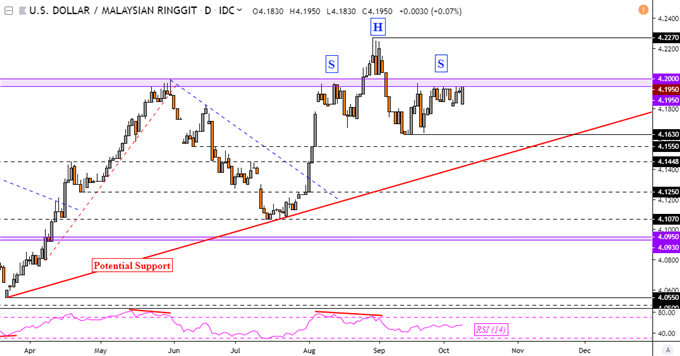
- USD/MYR still at risk to head and shoulders
Trade all the major global economic data live as it populates in the economic calendar and follow live coverage for key events listed in the DailyFX Webinars. We’d love to have you along.
USD/SGD Technical Outlook
The US Dollar may be carving out a Symmetrical Triangle continuation pattern against the Singapore Dollar. On the USD/SGD daily chart below, this formation would entail the resumption of the dominant uptrend since July given a close above the ceiling of the triangle. This resistance area goes back to the August peak where the next area of resistance awaits the currency pair around 1.3906 – 1.3942.
Check out my overview of the Singapore Dollar to get acquainted with its unique characteristics in forex
USD/SGD Daily Chart

USD/SGD Chart Created in TradingView
USD/INR Technical Outlook
Meanwhile, the Indian Rupee continues to carve out a Descending Triangle bearish reversal pattern against the US Dollar. After last week, the ceiling of the pattern was reinforced as USD/INR was unable to climb above it on multiple occasions. If resistance holds and paves the way for a test of the floor, a downside breakout may reverse upside gains from June. A daily close above the formation would invalidate the setup.
Read this week’s ASEAN fundamental outlook to learn more about the risks of US-China trade talks
USD/INR Daily Chart

USD/INR Chart Created in TradingView
USD/MYR Technical Outlook
The US Dollar is still at risk to downside pressure from the Malaysian Ringgit amid a Head and Shoulders bearish reversal pattern in USD/MYR. The right shoulder is holding at a range between 4.1950 and 4.2000. A daily close above this area would invalidate the setup. Otherwise, if resistance holds, that exposes the September low at 4.1630 before potential rising support from March.
To stay updated on fundamental developments for ASEAN currencies such as SGD and INR, you may follow me on Twitter here @ddubrovskyFX
USD/MYR Daily Chart

USD/MYR Chart Created in TradingView
USD/PHP Technical Outlook
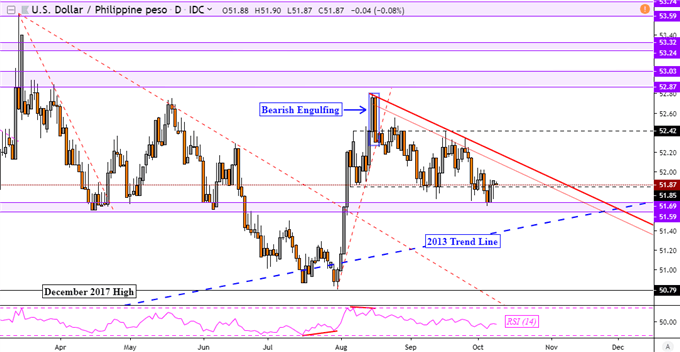
Against the Philippine Peso, the US Dollar is seeing consolidation slowly turn into selling pressure after USD/PHP topped in August. Prices are sitting just above key support which is a range between 51.59 and 51.69. If this area holds, that may place consolidation back in focus as the currency pair looks to retest descending resistance. This is a channel going back to the August highs – red parallel lines below.
USD/PHP Daily Chart

USD/PHP Chart Created in TradingView
FX Trading Resources
- Just getting started? See our beginners’ guide for FX traders
- Having trouble with your strategy? Here’s the #1 mistake that traders make
- See how the US Dollar is viewed by the trading community at the DailyFX Sentiment Page
--- Written by Daniel Dubrovsky, Currency Analyst for DailyFX.com
To contact Daniel, use the comments section below or @ddubrovskyFX on Twitter


