


US Dollar Technical Price Outlook: DXY Weekly Trade Levels
- US Dollar technical trade level update – Weekly Chart
- USD correction off uptrend resistance in focus- threat remains for deeper correction sub-108
- DXY weekly support 104.88, 103 (key), 101.94 – Resistance 107.67-108.09 (key), 110.25, 111.31
The US Dollar Index snapped a two-week losing streak with the DXY rallying more than 0.75% to trade at 106.66 ahead of the US close on Friday. A blow-out US Non-Farm Payroll report helped fuel a late-week surge with the index set to close near the weekly highs. Despite the gains, it’s not clear whether the technical correction off uptrend resistance has been completed and the focus heading into next week is on possible price inflection into resistance just higher. These are the updated technical targets and invalidation levels that matter on the US Dollar Index weekly price. Review my latest Strategy Webinar for an in-depth breakdown of thisDXY technical setup and more.
US Dollar Index Price Chart – DXY Weekly
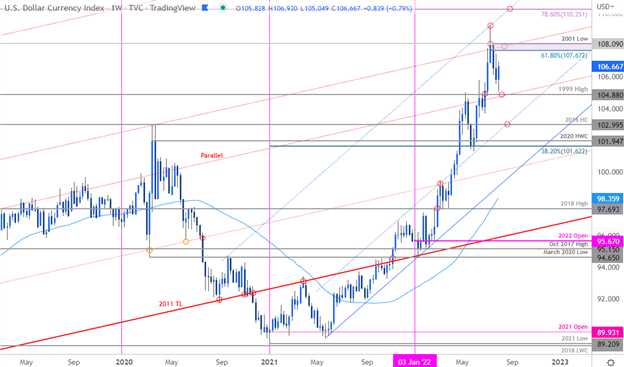
Chart Prepared by Michael Boutros, Technical Strategist; US Dollar Index on Tradingview
Notes: In last month’s US Dollar Weekly Price Outlook we noted that the DXY was at risk, “for a deeper correction within the broader uptrend – we’re on the lookout for downside exhaustion ahead of 104.77/88 IF price is still heading higher on this stretch.” Price registered a low at 105.04 into the August open before rebounding more than 1.7% - is this the onset of trend resumption or does the correction have further to go? We’re looking for guidance in early-month price action here.
Initial weekly support Initial weekly support is now seen at the July monthly open / 1999 high at 104.77/88 – an area of interest for possible downside exhaustion IF reached. Broader bullish invalidation is unchanged at the 2019 high-close near 103. Key weekly resistance stands with eh 61.8% Fibonacci retracement of the July decline / yearly high-week close / 2001 low at 107.67-108.09- a breach / weekly close above is needed to mark resumption of the broader uptrend towards 110.
For a complete breakdown of Michael’s trading strategy, review his Foundations of Technical Analysis series on Building a Trading Strategy
Bottom line:The focus is on this early-month US Dollar rebound- IF the correction off uptrend resistance is complete, losses should be limited to the objective monthly open at 105.82. From a trading standpoint, the threat remains for a deeper correction / test of uptrend support before resumption – look to reduce long-exposure / raise protective stops on a stretch towards 107.67-108 IF reached. Ultimately, a larger pullback may offer more favorable opportunities closer to trend support. I’ll publish and updated US Dollar Short-term Price Outlook once we get further clarity on the short-term DXY technical trade levels.

US Economic Calendar
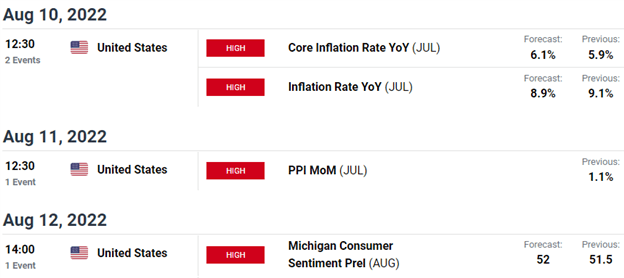
Economic Calendar - latest economic developments and upcoming event risk.
Active Weekly Technical Charts
- Euro (EUR/USD)
- Gold (XAU/USD)
- Silver (XAG/USD)
- Crude Oil (WTI)
- Australian Dollar (AUD/USD)
- British Pound (GBP/USD)
- Canadian Dollar (USD/CAD)
- S&P 500, Nasdaq, Dow
--- Written by Michael Boutros, Technical Strategist with DailyFX
Follow Michael on Twitter @MBForex


