


Gold Technical Forecast: Bearish
- Gold prices were down on the week while continuing to work through the long-term zone at 1900-1923.70 but, notably, gold set a fresh two-month-low.
- Gold had come into the month of April with strength, running up for a test of the $2,000 psychological level. But matters turned shortly after that resistance test and buyers haven’t been able to stem the bleeding yet. Next week’s FOMC presents yet another risk for bulls.
- The analysis contained in article relies on price action and chart formations. To learn more about price action or chart patterns, check out our DailyFX Education section.

Gold prices are going into the month of May with some fairly bearish potential. And given the drivers with the Fed expected to hike rates while warning of more to come, there could be more downside for Gold prices. And this is quite the change from just a month ago.
As Gold was coming into the month of April, bulls had found some stability on a long-term zone of support/resistance that runs from 1900-1923.70. The former of those prices is a major psychological level while the latter was the all-time-high for almost a decade in Gold, until the breakout in the summer of 2020. That build of support allowed for some equilibrium in price that bulls took advantage of, eventually forcing a topside move that presented some breakout potential, and that led into a test of the $2,000 psychological level two weeks ago.
But, after that level traded, matters quickly began to shift and sellers started to show a more forceful hand. Prices eventually pushed back to the 1900-1923.70 support zone and this time, sellers started to gain some additional ground. When I looked at Gold on Monday I highlighted bearish potential, with focus on a push down to a deeper support level around a prior point of resistance, taken from around 1879. That price traded on Wednesday and Thursday with seller setting a fresh two-month-low before a quick pullback developed.
And when the pullback developed – price found resistance at the ‘r2’ price that I had looked at in that Monday article before scaling back down to the 1900 level.
The net result of Friday’s price action was a shooting star showing rejection at that second resistance level at 1918.30. The weekly close below 1900 is similarly a bearish factor that will remain relevant into next week’s open.
Gold Daily Price Chart

Chart prepared by James Stanley; Gold on Tradingview
Gold Technical Forecast: Bearish
For next week there’s some major event risk on the economic calendar. The Federal Reserve rate decision is the obvious item but there’s also NFP on Friday. Perhaps more pressing, fear around what the FOMC might say or do on Wednesday has clearly brought a significant impact on markets already, and as the world braces for higher rates out of the U.S., it doesn’t appear as though there’s an easy way out for the Fed.
From the weekly chart, we can get a better picture of how key the support zone that was tested through this week has been. This area provided support for almost a full month after the initial February spike on the back of the Russian invasion of Ukraine. But, as sellers begin to grind price below this key spot on the chart, further pressure can allow for a deeper bearish move towards the swing around 1843.30.

Gold Weekly Price Chart
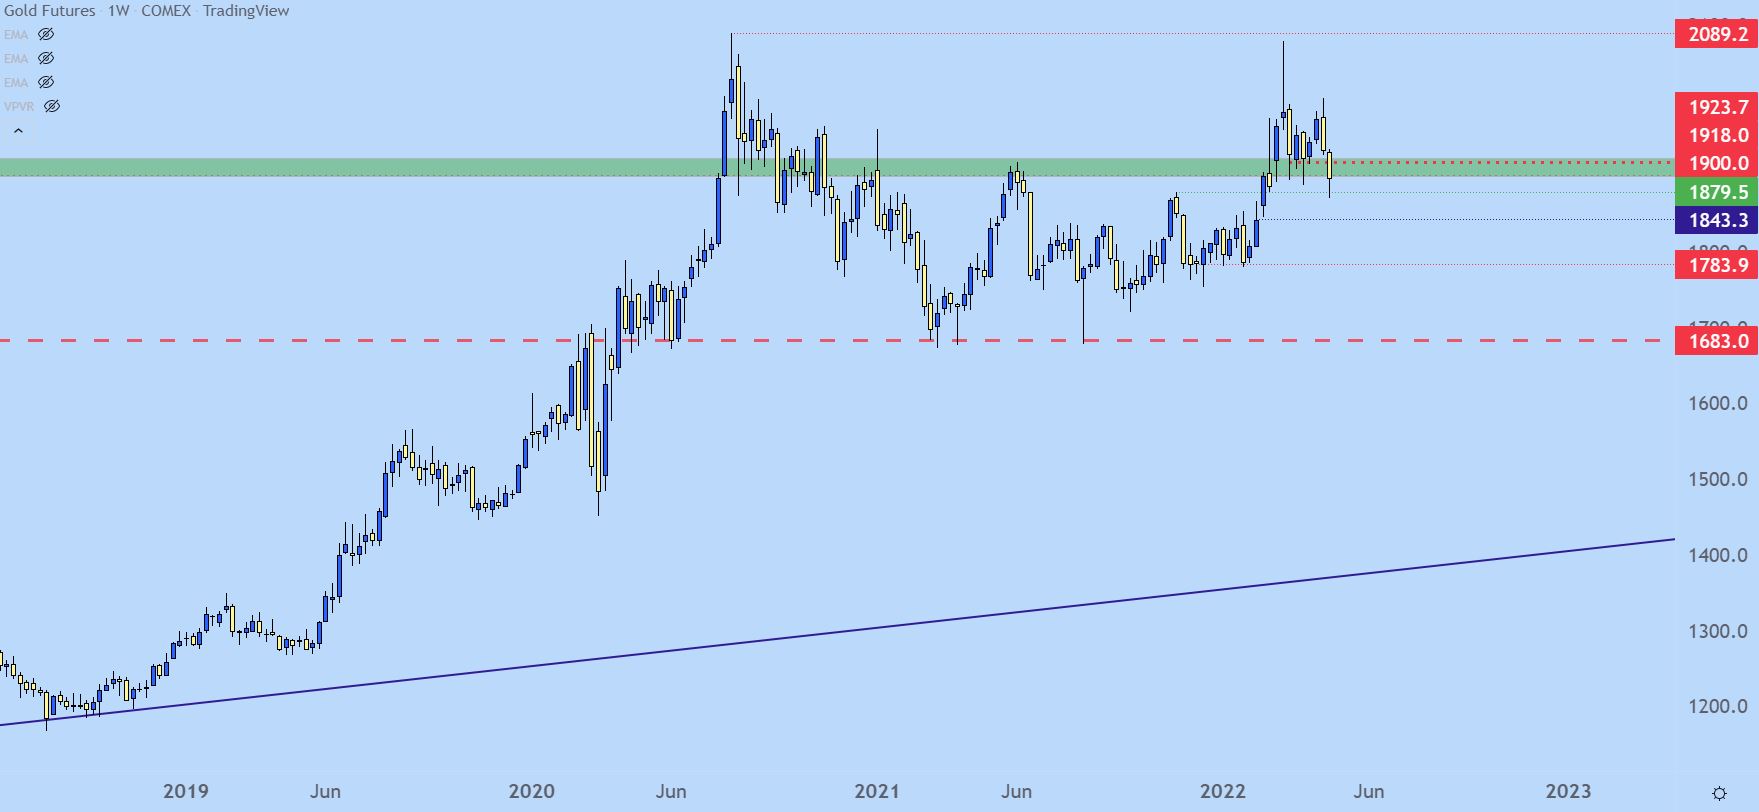
Chart prepared by James Stanley; Gold on Tradingview
Gold Shorter-Term: Levels for Next Week
On the underside of Gold there’s a couple of key areas to keep in consideration, particularly if a bigger picture breakdown theme begins to show. There’s a pocket of support potential from 1888-1891, and if sellers can push through that, we have the same 1879.50 level that I talked about on Monday. This is followed by the current two-month-low in Gold at 1871, and a breach below that opens the door for a sizable step down, towards that 1843 support looked at above.
On the resistance side, I’m keeping the same levels that were in use this week, plotted at 1908 and 1918 with the 1923.70 level serving as an ‘r3’ spot of resistance potential.
Gold Four-Hour Price Chart
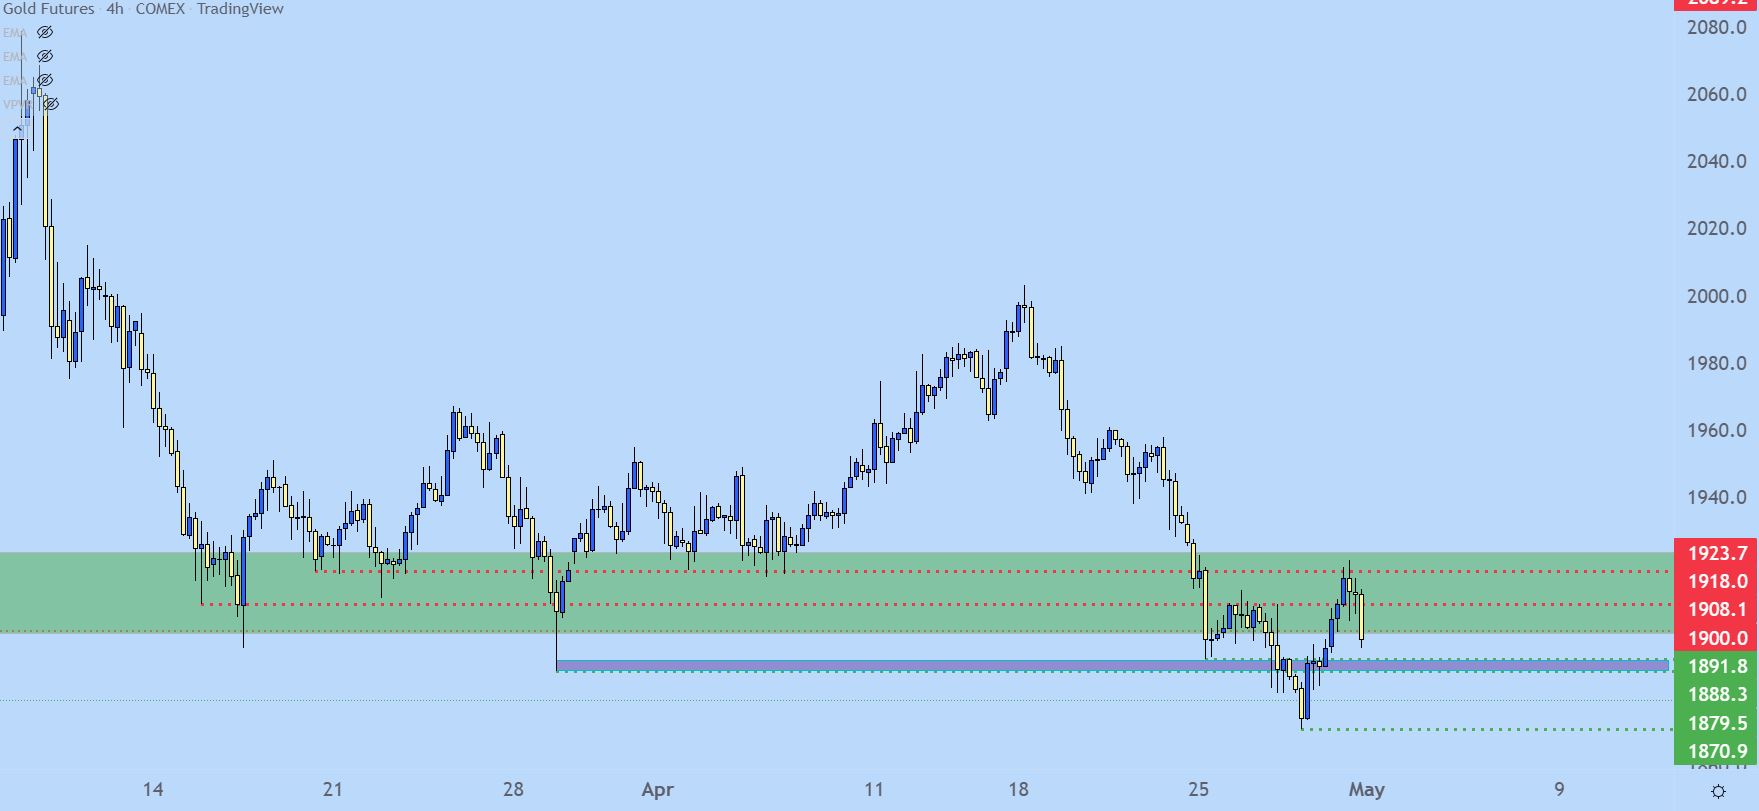
Chart prepared by James Stanley; Gold on Tradingview
--- Written by James Stanley, Senior Strategist for DailyFX.com
Contact and follow James on Twitter: @JStanleyFX


