


GBP/USD & EUR/GBP: BRITISH POUND WEEKLY TECHNICAL FORECAST
- The British Pound Sterling looks to extend its rebound off multi-year lows as GBP/USD finds buoyancy around the 1.2000 handle
- EUR/GBP upward momentum fades further and the currency pair could continue its retracement lower with Brexit on the backburner
- Enhance your forex trading skills with this free educational guide that outlines the Top Traits of Successful Traders
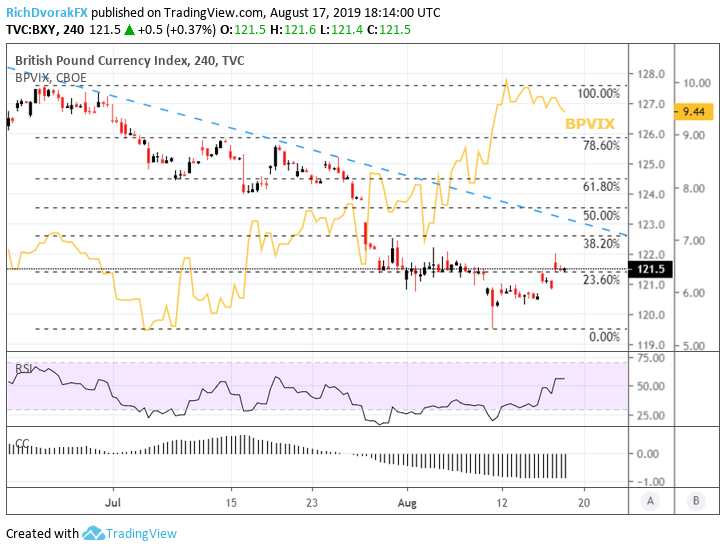
GBP prices jumped 1% on balance over the past 5 trading days measured via the BXY British Pound Currency Index. Last week’s rebound in the Sterling snapped a 4-week losing streak as GBP/USD and EUR/GBP bounce off technical confluence levels dating back multiple years. Looking ahead, the British Pound could continue clawing back some its downside if Brexit uncertainty – quantified by BPVIX, Cboe’s 30-day implied British Pound volatility index – fades from its recent runup.
BXY – BRITISH POUND CURRENCY INDEX PRICE CHART: 4-HOUR TIME FRAME (JUNE 19, 2019 TO AUGUST 16, 2019)
Created with TradingView
That said, a sustained retracement for GBP prices could be in the cards over the near-term with the return of the generally inverse correlation between the British Pound and BPVIX as expected volatility recedes. Also, the positive tailwind from better-than-expected UK economic data could alleviate GBP selling pressure while no-deal Brexit risks take the backseat with Parliament on recess next week.
GBP/USD PRICE CHART: DAILY TIME FRAME (FEBRUARY 28, 2019 TO AUGUST 16, 2019)
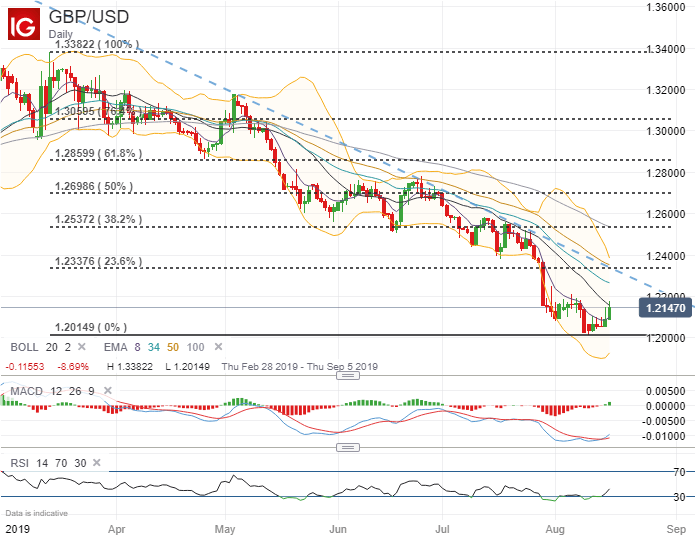
Spot GBP/USD caught a bid slightly above the physiologically-significant 1.2000 price level which has previously served as an area of technical support dating back to late 2016 and early 2017. The British Pound could ride upward momentum suggested by the rising RSI out of oversold territory and the 8-day EMA starting to trend higher. If spot GBP/USD can top its month-to-date high of 1.2210, it could open the door for bulls to test technical resistance posed by the currency pair’s overarching bearish trendline.
The next possible upside target could be the 23.6% Fibonacci retracement level of spot GBP/USD’s trading range etched out so far this year. Yet, the 20-day SMA in addition to the 34-50-100-day EMA envelope threaten to exert downward pressure on spot GBP/USD. Also, if Sterling selling accelerates once more, a retest of August’s low could quickly be eyed by bears. Beneath this level, spot GBP/USD could turn to January 2017’s low of 1.1982 for support.
EUR/GBP PRICE CHART: DAILY TIME FRAME (APRIL 26, 2019 TO AUGUST 16, 2019)

The recent influx of strength exhibited by the British Pound Sterling is more evident when looking at spot EUR/GBP price action. After slightly overshooting its August 2017 swing high earlier this month, the currency pair has already retraced 23.6% of its steep ascent started back in May as EUR/GBP price momentum fades. If spot EUR/GBP firms its footing below this key Fibonacci retracement level near the 0.9130 price zone, bears could stage another push lower toward the 0.9000 handle where technical support is more likely to come into play around the bullish trendline and 38.2% Fib highlighted above.
EUR/GBP – IG CLIENT SENTIMENT INDEX PRICE CHART: DAILY TIME FRAME (FEBRUARY 18, 2019 TO AUGUST 16, 2019)
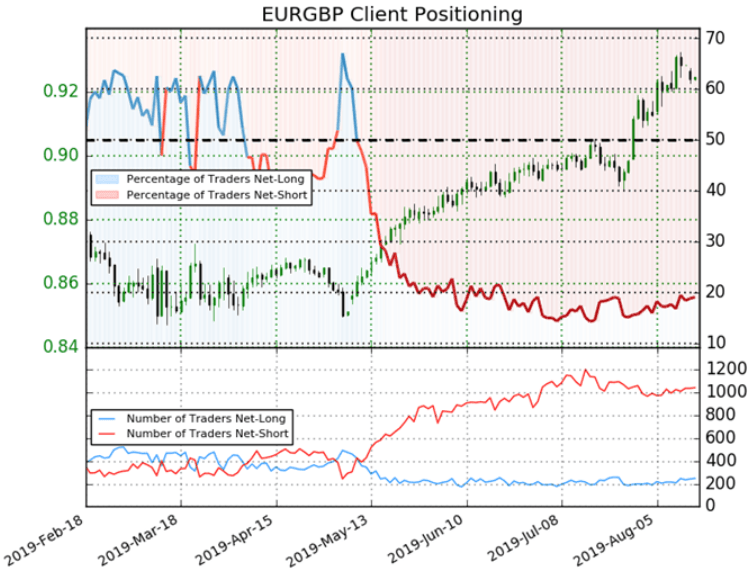
Also, when judging changes in crowd sentiment with a contrarian perspective, retail trader positioning data on EUR/GBP reveals that spot prices have potential to solidify a reversal lower. In fact, the latest IG Client Sentiment figures on EUR/GBP show that the number of traders net-long is 14.4% higher compared to last week which outpaced the 4.1% increase in net-shorts over the same period. Although the overwhelming bearish bias remains suggested by the ratio of traders short-to-long at 4.22 to 1, retail traders are growing increasingly bullish on EUR/GBP and could therefore indicate a bearish contrarian trading bias.
FOREX TRADING RESOURCES
- Download the Q3 DailyFX Forecasts for comprehensive fundamental and technical analysis on major currencies like the US Dollar and Euro in addition to equities, gold and oil
- Sign up for Live Webinar Coverage of the financial markets hosted by DailyFX analysts where you can have all your trading questions answered in real-time
- Find out how IG Client Sentiment data can be used to identify potential forex trading opportunities
-- Written by Rich Dvorak, Junior Analyst for DailyFX.com
Connect with @RichDvorakFX on Twitter for real-time market insight


