
Gold Technicals Talking Points:
- Friday, gold earned its best single-day rally since March 8th and the headiest week in 3 months
- The turn happened around a tech level of note (1265), but is this enough to recharge a H&S break?
- See how retail traders are positioned in gold, oil, indices and key FX pairs in real time
Technical Forecast for Gold Prices: Bullish
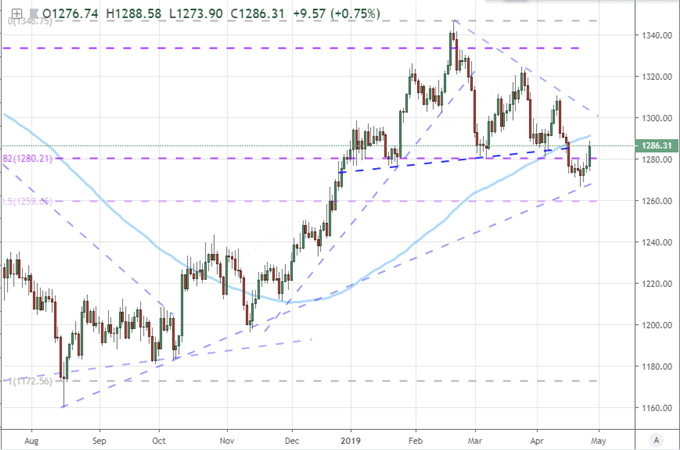
Not long ago, gold prices marked a critical technical breakdown. On Tuesday, April 16, the precious metal dove through the 1,285-1,280 confluence of the 100-day moving average, a double bottom, a Fibonacci retracement of the August to February climb and a trendline that stood as the ‘neckline’ on a very prominent 2019 head-and-shoulders pattern. Technically-speaking, signals rarely come across any clearer than that. Fast forward to our current condition with a tentative swell building back up behind the commodity, we cannot simply discount the bearish move that was earned before. We have put in for the strongest week’s advance in three months (back to the final week of January) and this past Friday alone earned the best run since March 8th.
The short-term implication of the course correction will draw those always on the hunt for reversal, but we should take the performance in context with the bigger picture performance. The head-and-shoulders (H&S) breakdown was very easy to recognize which will afford it greater weight in dictating views among chart traders even if we continue to pressure the former support as new resistance. On the other hand, if we evaluate the market on the basis of the past eight months rather than just the past two, it could be argued that the prevailing trend is still bullish. So the question facing gold traders is whether we are returning to a dominant trend or if this is simply a correction in the new prevailing bear trend.
Chart of Gold and 100-day Moving Average (Daily)
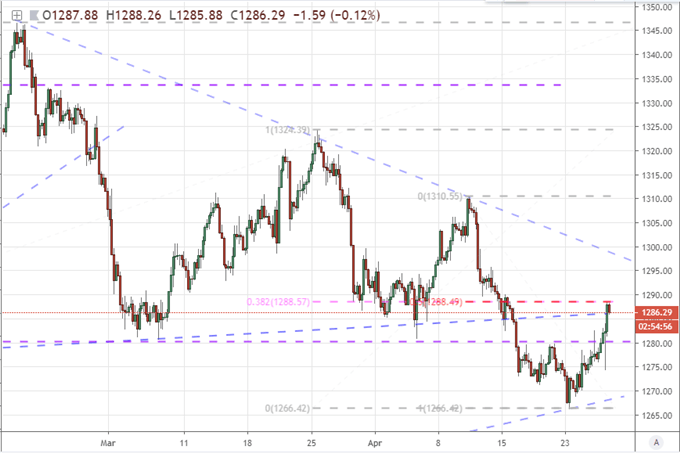
In this transitional evaluation of the prevailing technical winds, we should first lower the time frame. Below we are looking at the 240-minute (or 4 hour) periodicity chart. The turn that triggered the rally through the second half of this past week carries some minor influence in the form of an extended trendline from swing lows between August and November. I give significantly less weight to trendlines where the technical cues that established the ray are not evenly spaced or are more dated. This qualifies. Now, as gold climbs, we deal with our first technical boundary. We already overtook the 38.2% Fib of the previously mentioned bull phase and the double bottom in March/April at 1,280. The projected neckline as former support converting to new resistance may still carry some weight. Yet, the confluence of the 38.2% Fib to the March 25 – April 23 decline and midpoint from the April 10 – April 23 bear wave overlap at 1,289. Breaching this ceiling wouldn’t be difficult, however, and I would consider it range trading all the way up to the descending trendline resistance back from the February peak which now falls around approximately 1,300. Overtaking that would silence many bearish holdouts.
Chart of Gold (4 Hour)
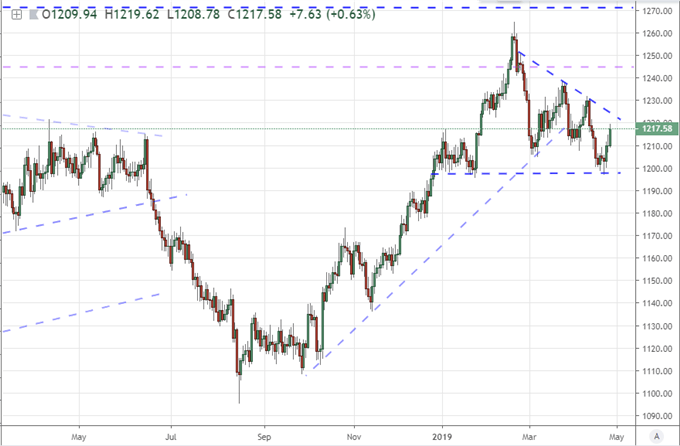
One consideration for all technical – and fundamental – gold traders is the undue influence that can come through the Dollar. The primary pricing instrument for the precious metal is the Greenback, and most traders are therefore established on that basis. That said, temporary volatility that is derived from the currency can generate unrealistic expectations for an instrument like gold. Further, trends that arise in the commodity can sometimes be temporarily cloaked by countervailing winds generated from a motivated currency. When those winds die down, the commodity can seem as if it is suddenly coming to life – when in fact, it is a momentum that has always been there. To help block out the heavy influence of the USD, below we have a chart of a synthetic, equally-weighted gold index that prices using the Dollar, Euro, Pound and Yen. The structure is still very similar, but the technical cues of the H&S are not as distinct hear as the general horizontal support we seemed to hold. Consider this as you weigh trend versus correction.
Chart of an Equally-Weighted Gold Index (Daily)
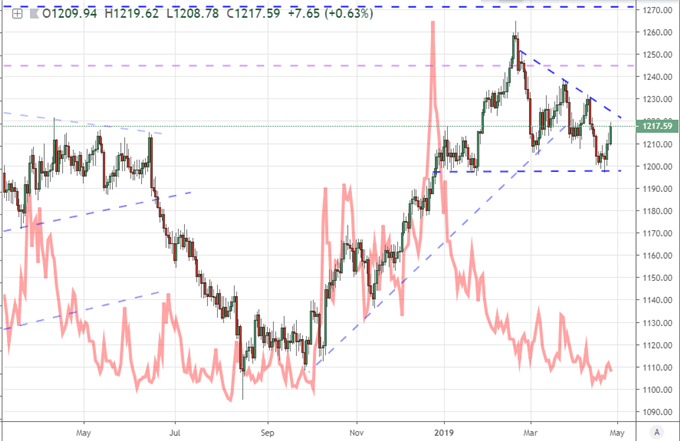
If you want a genuine overview of gold, it is important to have a dose of fundamentals to understand motivation – but we can do this in more practical terms through charts. Below, we have the same gold index overlaid with the DXY Dollar Index. The very rudimentary assumption is that traders want gold when the benchmark currency is dropping and vice versa. Those more familiar with the market know they can actually move in tandem as they both represent safe havens. Yet, interest rate implications for the Greenback can still act as a rudder for a commodity that offers no yield of its own. Clearly, the metal has advanced as the currency has drifted slowly, slowly higher. Further, the critical breakout from the Dollar this past week didn’t seem to put off the commodity. I believe the greatest potential motivator for gold moving forward would come from a general demand for alternatives to the major currencies and the financial assets they represent. The Dollar can move through spells of being an alternative to its other FX counterparts, but it too can come under pressure. So, don’t put too much reliance on this correlation moving forward.
Chart of Equally-Weighted Gold Index Overlaid with US Dollar (Daily)
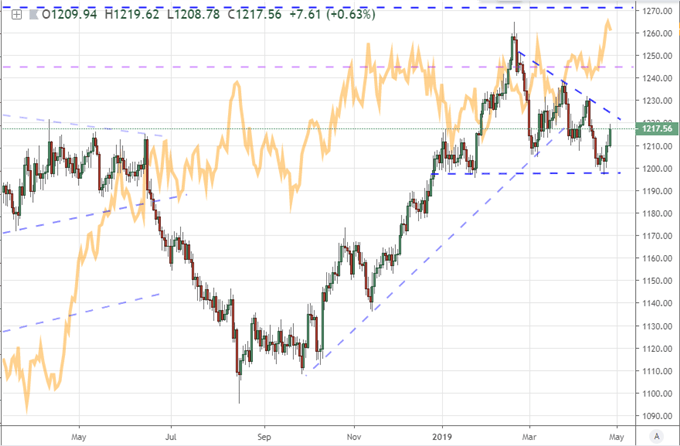
Another role that gold has exploited at convenient points recently is its position as a ‘safe haven’ asset. I have it set against the VIX Volatility index below, and the climb alongside VIX through the fourth quarter of 2018 is unmistakable. Yet, the deviation that we’ve seen in performance since is also hard to miss. The positive relationship now comes to the S&P 500 and Dow. This is more likely a defect in the ‘risk appetite’ signal that we are being fed from the US indices – most other speculative assets are showing considerably more struggle. That said, pay more heed to the progress in gold technicals than falling back on an unreliable fundamental role.
Chart of Equally-Weighted Gold Index Overlaid with VIX Volatility Index (Daily)
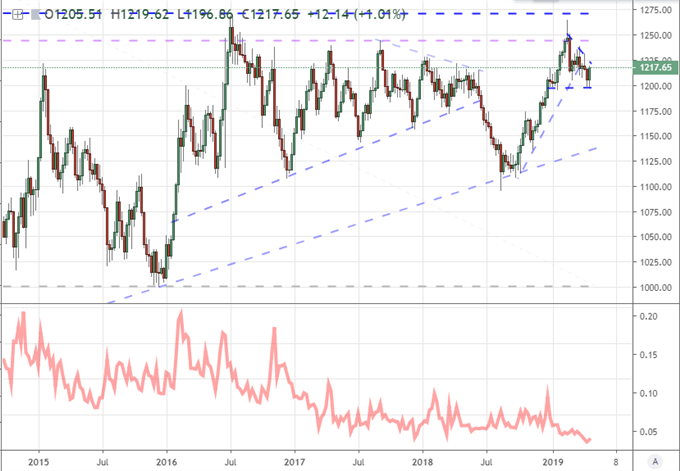
Gauging the activity level of the metal itself – rather than its relationship to other assets activity/fear – we see below the gold index atop the CBOE’s volatility index for the commodity. Expected swings for this market has dropped alongside the realized measures offered from the likes of the ATR (average true range). What this suggests is that we are likely working our way to a normalization of market swings – which means a breakout (that is not to imply up – that would be breakup/breakdown). Consider though that this is a pattern that has taken significant time to develop on a weekly chart. It is not a necessity breakout for the week ahead – but stands ready if prompted.
Chart of Equally-Weighted Gold Index with CBOE’s Gold Volatility Index (Weekly)
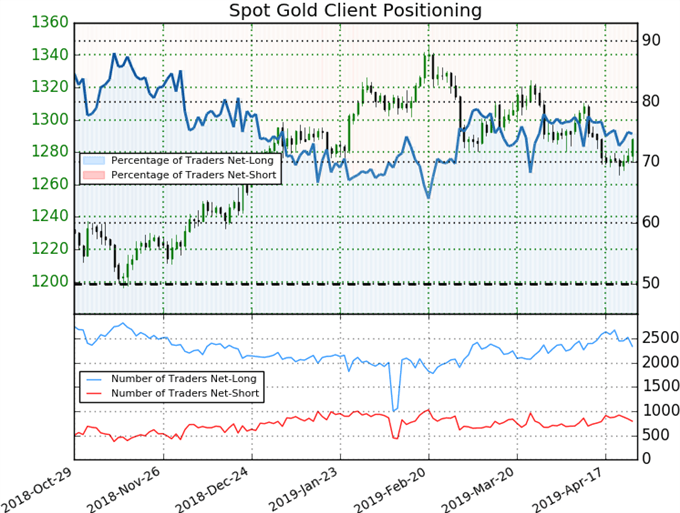
Finally, positioning can tell us how different trade groups are positioning and what they may be setting up for in next moves – participating or fading. From the larger futures traders measured by the CFCT’s Commitment of Traders (COT) report, we have seen a downdraft in the net long positioning after the metal failed to make a more committed move when 1,350 held back the bulls. There is very clearly a descending peak of long interest in the preceding three years efforts at a range resistance. Flipping to a net short position again in the coming weeks looks more and more likely. Retail traders in the meantime characteristically fade the swings that we have seen these past few months – though the buy-and-hold long interest is a very strong contingent in even the retail group unlike FX or indices. The range reversal participation has diminished notably, and there isn’t a strong conviction to be seen in this most recent upswing from the 1,270 area.
Chart of Net Speculative Positioning in Gold Futures from CFTC Report (Weekly)
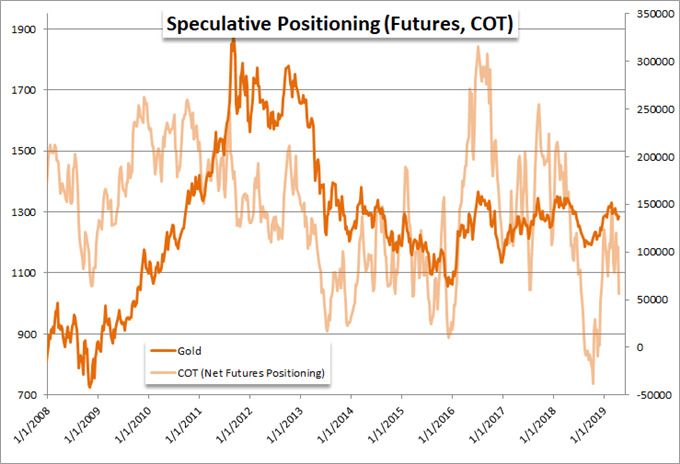
Chart of Retail Trader Positioning from IG Clients (Daily)