


Stock Market Technical Outlooks:
- The Dow Jones will look to consolidate gains above 26,000
- Germany’s DAX looks to breakthrough longer-term resistance
- The Nikkei looks to continue its upward churn
At a time when fundamental risks seem to be in flux, the technical landscape for global indices is relatively concrete and looks skewed to the downside. Follow me on Twitter @PeterHanksFX to participate in polls that can dictate what indices appear in the weekly outlook.
S&P 500 Price Chart: 4-Hour Time Frame (October 2018 to February 2019) (Chart 1)
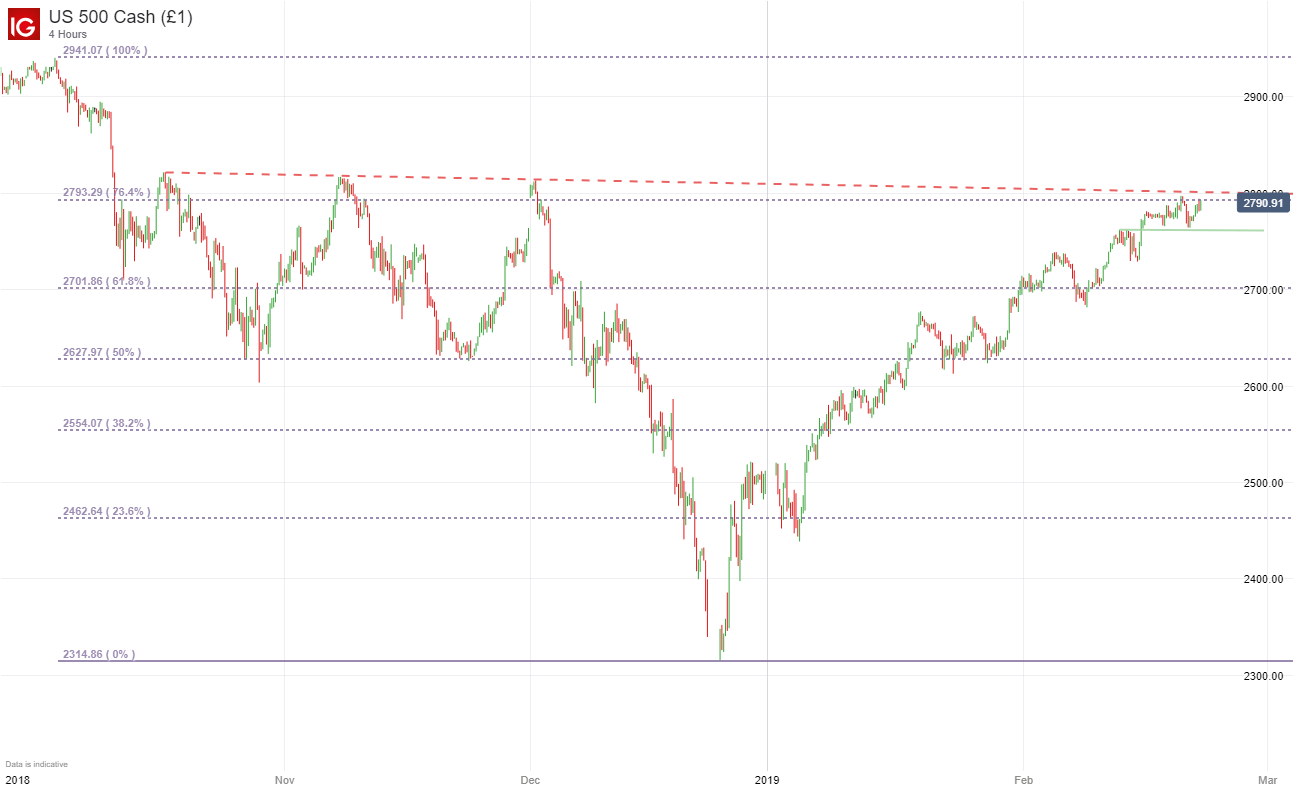
The S&P 500 trades narrowly below a resistance trendline that has held since October 2018. The trendline has rebuked the index three times and may look to do so again next week. Also in the area is the 76.4% Fibonacci retracement level from October’s high to December’s low. When combined, the two technical levels create significant resistance around the 2,792 and 2,805 levels. Similarly, 2,800 is a notable psychological level for the index.
Looking for a fundamental perspective on equity? Check out the Weekly Equity Fundamental Forecast.
Dow Jones Price Chart: 4-Hour Time Frame (October 2018 - February 2019) (Chart 2)

The Dow Jones also trades near a notable psychological level after it closed above 26,000 on Friday. The level may now provide a semblance of support but such a narrow close above is not confidence inducing. Still, it is a level to watch out for. Similarly, support rests nearby at the 76.4% Fibonacci retracement around 25,652. The level is joined by a trendline originating from early January.
Dax Price Chart: 4-Hour Time Frame (October 2018 - February 2019) (Chart 3)
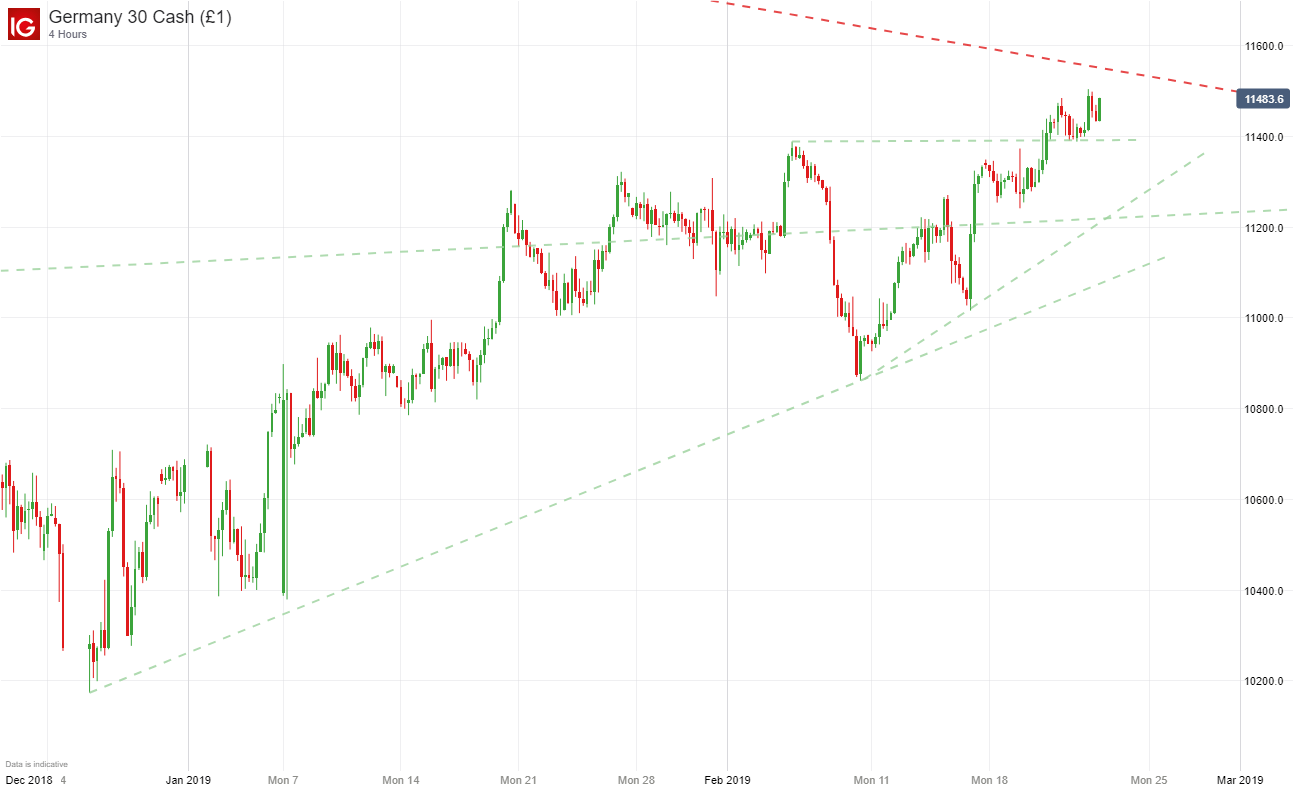
The German DAX is nearing longer-term resistance from June 2018. The trendline appears to be the first hurdle on the road higher. Support can be found around 11,400, a swing high from early February and a level that provided moderate support last week.
Nikkei Price Chart: 4-Hour Time Frame (December 2018 - February 2019) (Chart 4)

In recent weeks, the Nikkei 225 has found itself in a slow churn upwards. The next level of resistance appears to be around 21,540, a price the index has not crossed since mid-December. Support resides in the lower bound of the channel
--Written by Peter Hanks, Junior Analyst for DailyFX.com
Contact and follow Peter on Twitter @PeterHanksFX
DailyFX forecasts on a variety of currencies such as the Pound or the Euro are available from the DailyFX Trading Guides page. If you’re looking to improve your trading approach, check out Traits of Successful Traders. And if you’re looking for an introductory primer to the Forex market, check out our New to FX Guide.
Other Weekly Technical Forecast:
Australian Dollar Forecast – AUD/USD, AUD/JPY and AUD/NZD Eye Trend-Forecasting Patterns
Oil Forecast– Bears May Want to Turn Away, Momentum is Here
British Pound Forecast – Selling Off Into Support
US Dollar Forecast – Dollar Faces Volatility Potential but Breakout and Trends are Still Far Reach
Gold Forecast– Prices May Be Readying to Reverse 6-Month Dominant Uptrend
Euro Forecast – EURUSD Weekly Technical Forecast: Euro to Weaken in Days Ahead


