


Australian Dollar Technical Forecast
- AUD/USD finds itself in a bearish reversal pattern, will it fall?
- AUD/JPY meanwhile is in a bullish one, perhaps eyeing gains
- AUD/NZD solidified a descending channel, downtrend to resume?
Have a question about what’s in store for Australian Dollar next week? Join a Trading Q&A Webinar to ask it live!
In this week’s poll, the top two requested Aussie crosses to cover in addition to AUD/USD were AUD/JPY and AUD/NZD. For the opportunity to participate in the future, I will be conducting votes every week on my Twitter account which you may follow here @ddubrovskyFX. There, you will also find more timely updates on the Australian Dollar.
AUD/USD Technical Outlook: Bearish
Previously, I offered a neutral outlook on AUD/USD as prices were on the verge of testing critical resistance between 0.71452 and 0.71645. Another obstacle that was standing in its way was a descending trend line from the middle of January. This past week, this area proved too difficult to break as expected. The fundamental backdrop for AUD/USD’s decline was as a result of China’s Dalian Port banning Australian coal imports.
Looking for a technical perspective on the Australian Dollar? Check out the Weekly AUD Technical Forecast.
Looking at the AUD/USD daily chart below, it appears we have a descending head and shoulders candlestick pattern. This is typically seen as a bearish reversal formation. Prices find themselves sitting right around the right shoulder. If resistance holds, the pair may turn lower and test the neckline of the pattern. This is defined by the downward sloping support line from January 8 (third parallel red dashed line below). A climb that holds above 0.71645 may overturn this bearish reversal warning sign.
AUD/USD Daily Chart

AUD/JPY Technical Outlook:Bullish
AUD/JPY also seems to find itself within a candlestick formation, this one is an ascending triangle. Looking at the daily chart below, this pattern is constructed by combining the rising support line from the beginning of this year with the February highs (79.84). Ascending triangles are typically seen as continuation patterns and would imply that AUD/JPY’s upward progress since January could have more room to go.
A close above 79.84 with confirmation could be this bullish signal. The problem is that immediately above this candlestick formation is a range of former support now resistance between 80.62 and 81.14. This area proved to be a formidable point of interest on multiple occasions since May 2018. Closing above it exposes December highs. Meanwhile, a descent through triangle support exposes 77.49 followed by 75.24.
AUD/JPY Daily Chart

AUD/NZD Technical Outlook:Slightly Bearish
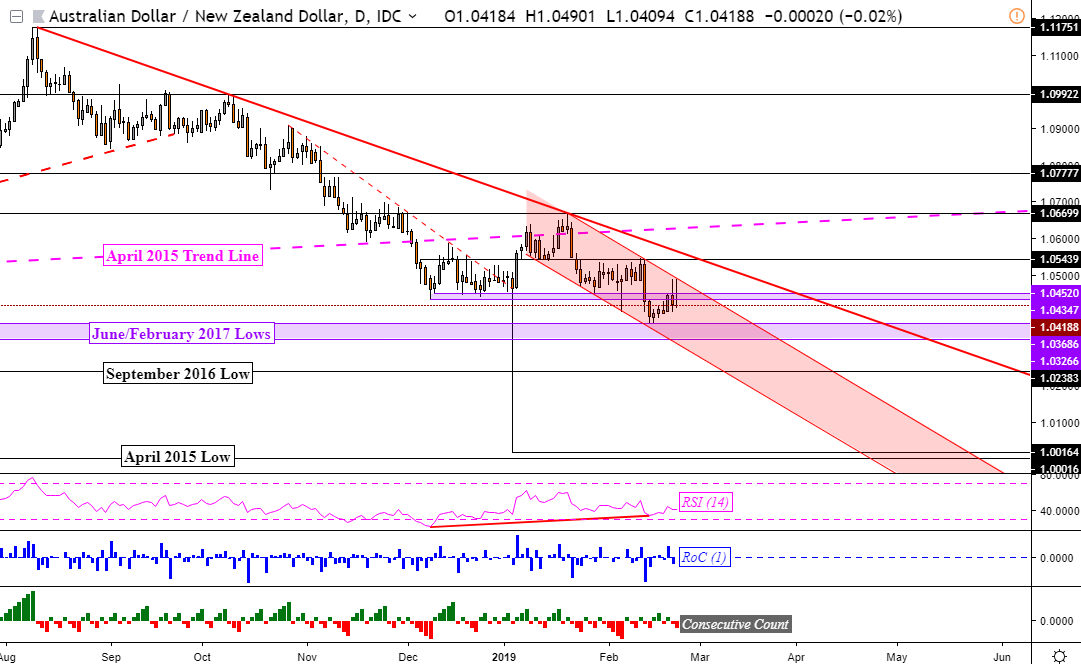
AUD/NZD paused its descent from late January this past week after key support held at 1.03686. Prices turned cautiously higher amidst positive RSI divergence pointed out last week which showed fading downside momentum. I thought that the break under persistent support at 1.04347 would ensue a resumption of the dominant downtrend. That was not the case. But, the rebound this past week failed to push back above it.
This past week, AUD/NZD solidified a descending channel as a falling resistance line from January prevented a more aggressive turnaround. The support line of the channel goes back to early January. If this channel holds, AUD/NZD may see the dominant downtrend from August 2018 resume. If this is the case, it will get another shot at pushing through the June/February 2017 lows on the chart below.
AUD/NZD Daily Chart
* Charts created in TradingView
FX Trading Resources
- Having trouble with your strategy? Here’s the #1 mistake that traders make
- See how the Australian Dollar is viewed by the trading community at the DailyFX Sentiment Page
- Just getting started? See our beginners’ guide for FX traders
--- Written by Daniel Dubrovsky, Junior Currency Analyst for DailyFX.com
To contact Daniel, use the comments section below or @ddubrovskyFX on Twitter


