


Sterling FX-Pairs Technical Analysis
We have recently released our Q1 Trading Forecasts for a wide range of Currencies and Commodities, including GBPUSD and EURGBP with our fundamental and medium-term term technical outlook.
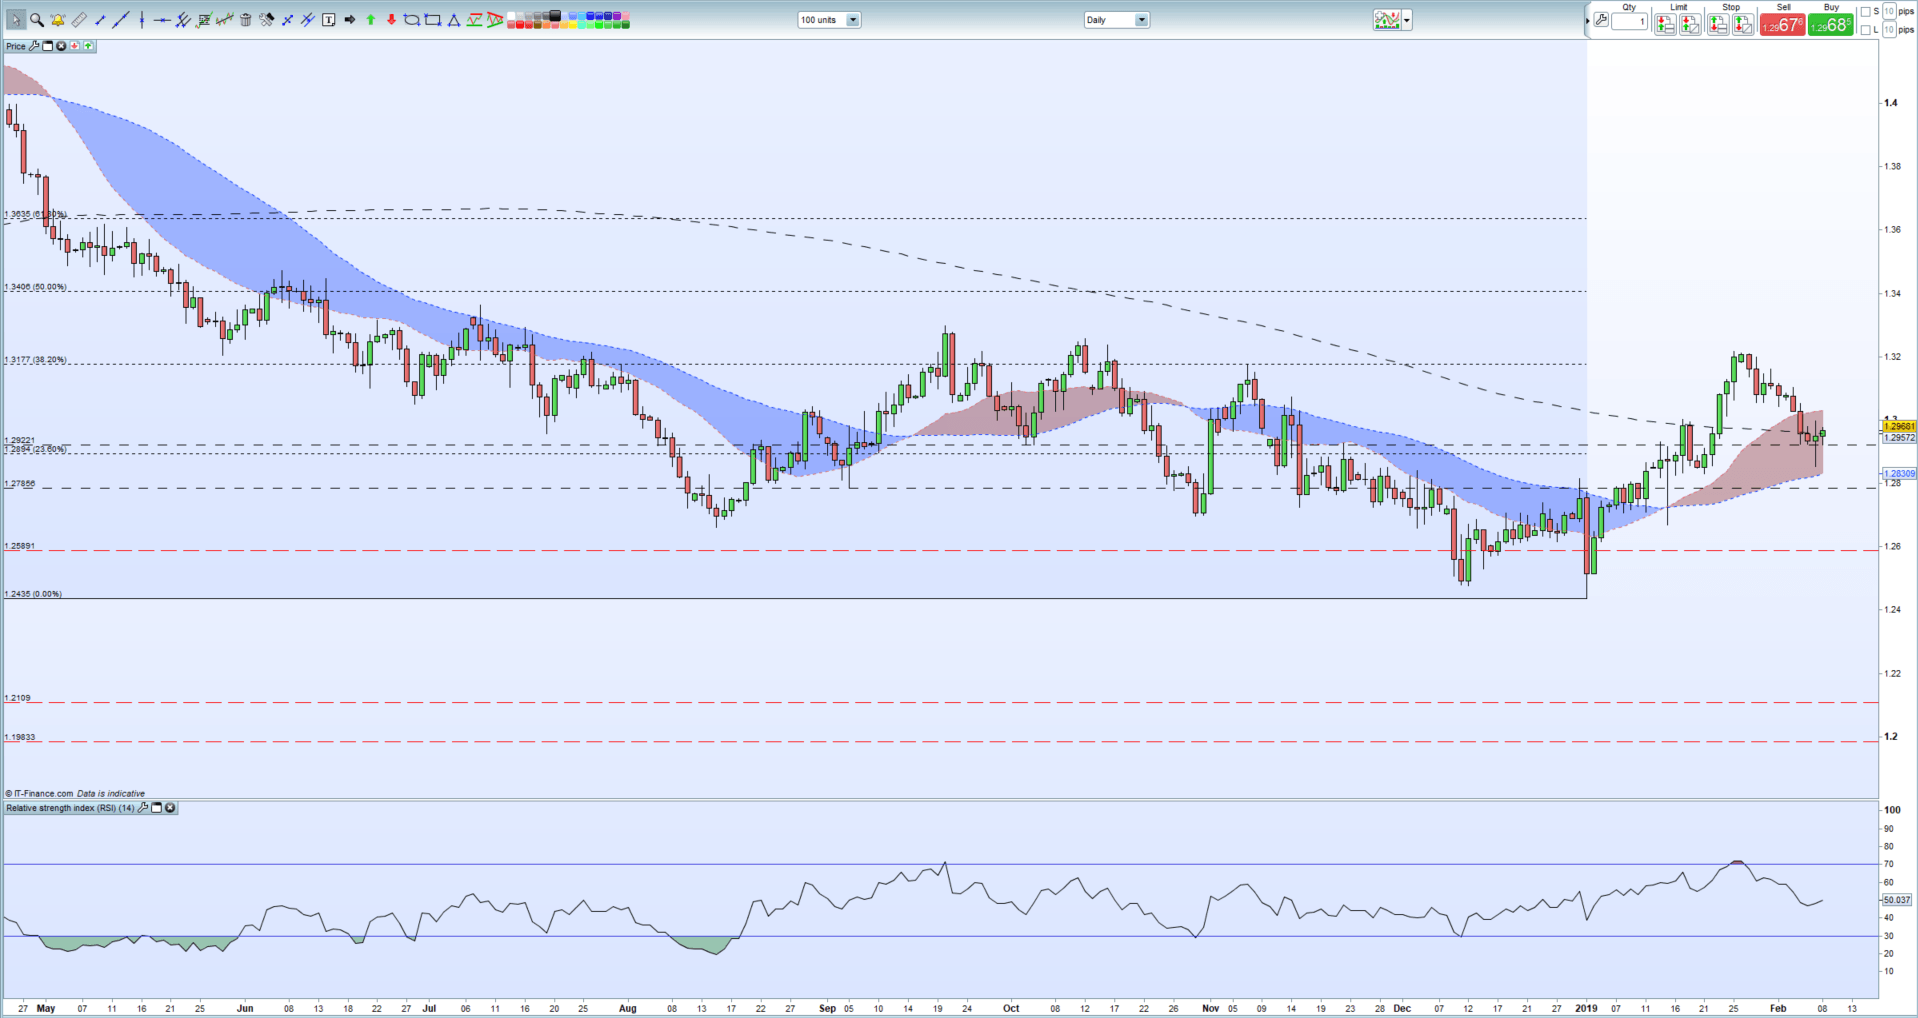
Cable has had a mixed week, dropping through the supportive 200-day moving average, hitting a near three-week below before bouncing back to currently trade either side of the long-term moving average. The last three-days have seen GBPUSD trade in between the 20- and 50-day moving averages at 1.3030 and 1.2835 respectively. The 23.6% Fibonacci retracement at 1.2894 was briefly pierced on Thursday and it remains to be seen if this level will act as solid support in the event of another re-test. The RSI indicator at the bottom of the chart has bounced off a one-month low and has just started to turn higher.
GBPUSD Daily Price Chart (April 2018 - February 8, 2019)
Something for the Weekend? – Becoming a Better Trader – Rules to Trade by | Webinar
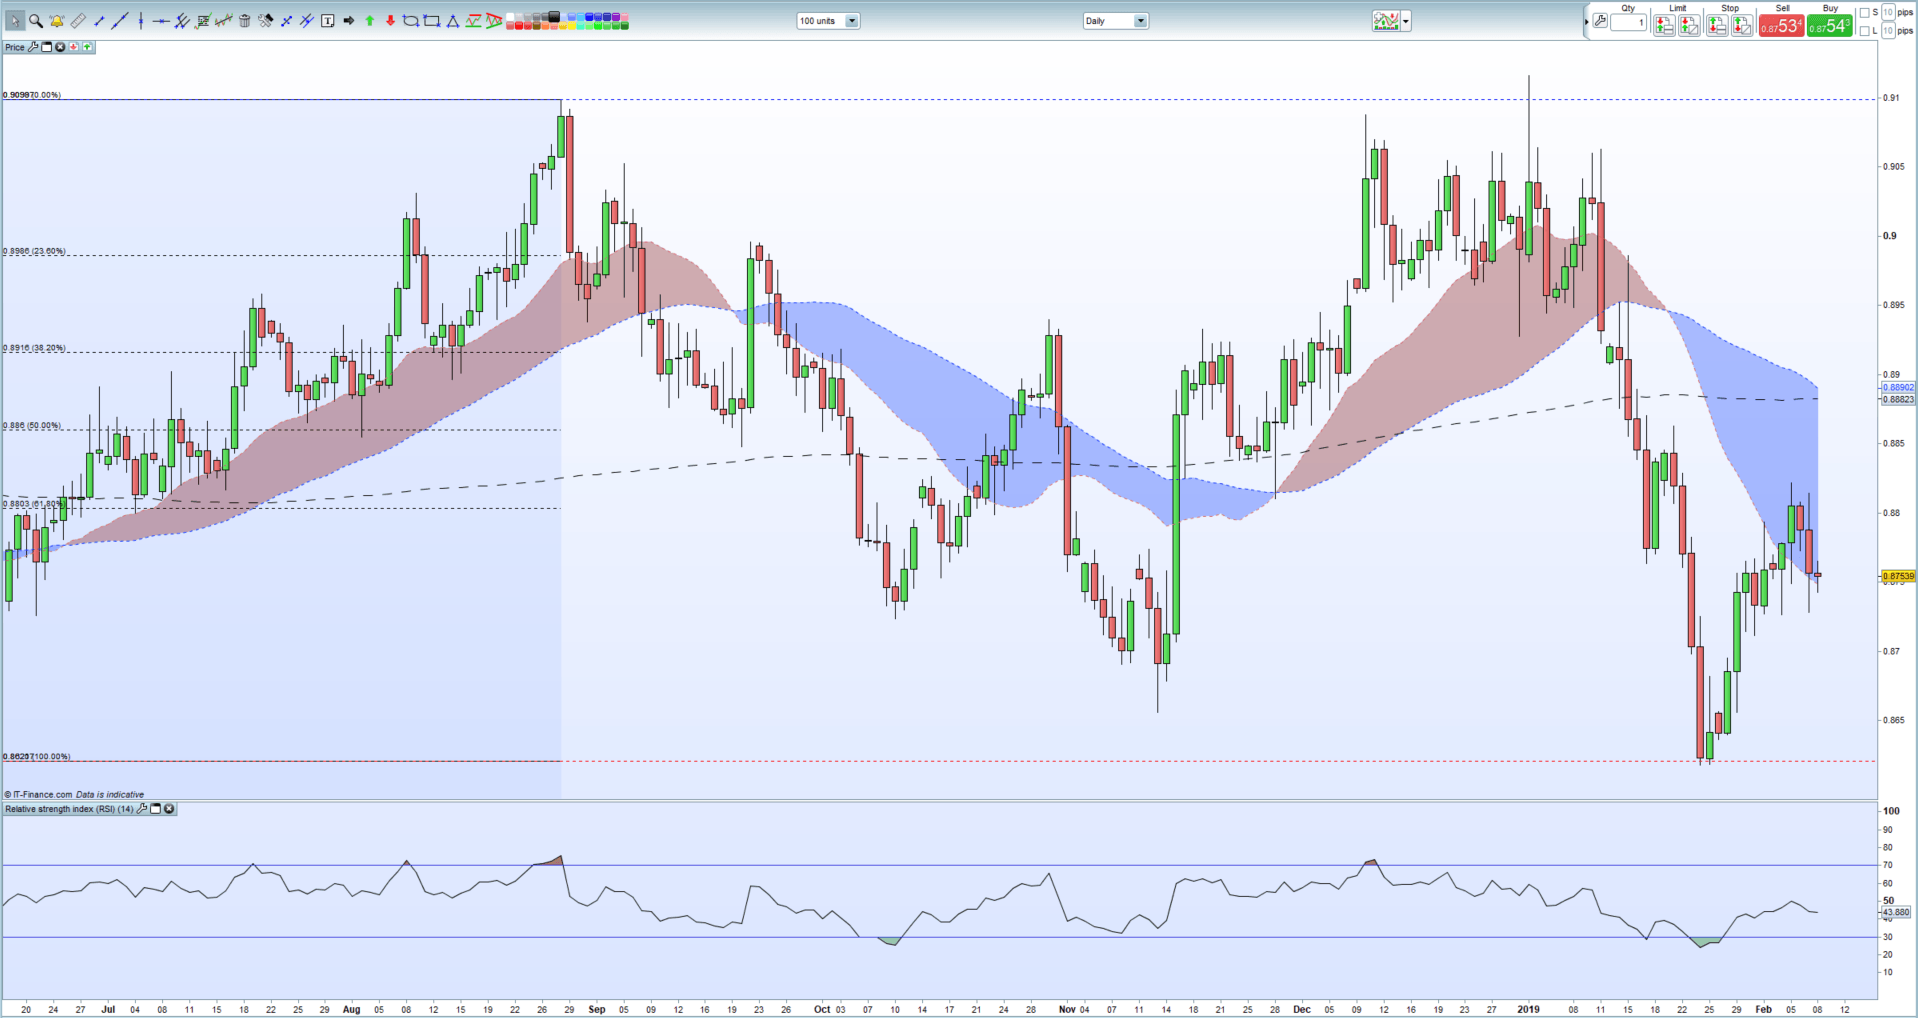
The daily EURGBP chart looks interesting with upside likely limited as we head into the new week. The pair broke through the 61.8% Fib retracement level at 0.8803 but the move higher lacked momentum and EURGBP turned sharply lower on Thursday. The Euro is currently struggling across a range of currencies on EU growth fears and a lack of positive fundamentals. On the chart the 20-day moving average traded through the 200-day ma two-weeks ago and the current set-up shows the 50-day ma likely to break below the lon-dated ma shortly, a ‘Death Cross’. While this may prompt further downside or not – analysts argue over the validity of this indicator - it does show that short-term sentiment has taken a turn for the worse, putting pressure on the pair. Resistance levels seen at 0.8803 ahead of 0.8860 with old horizontal support at 0.8725 ahead of 0.8655 and the recent multi-month low around 0.8615.
Looking for a fundamental perspective on Sterling? Check out the weekly Sterling Fundemental Analysis.
EURGBP Daily Price Chart (June 2018 - February 8, 2019)
Interest Rates and the Foreign Exchange Market
DailyFX has a vast amount of resources to help traders make more informed decisions. These include a fully updated Economic Calendar, and a raft of constantly updated Educational and Trading Guides
--- Written by Nick Cawley, Analyst
To contact Nick, email him at nicholas.cawley@ig.com
Follow Nick on Twitter @nickcawley1
Other Weekly Technical Forecast:
Australian Dollar Forecast - Australian Dollar Strength Falls Apart, Can AUD/CAD Breakout Last?


