


Talking Points:
- The Dollar has proven remarkably impervious to rising volatility across the financial system
- Between 97.70 and 95.80, DXY is likely soon to break its smallest 50-day range since Aug 2014
- See the 1Q 2019 fundamental and technical forecast for the Dollar updated on our trading guides page
Technical Forecast for US Dollar: Bearish
We have started the new trading year in earnest, but the Dollar continues to hold to the range it maintained through the final two months of 2018. That is unlikely to be the case for much longer however. The rest rate of volatility has increased across the entire financial system. We have seen volatility in US equities in particular surge both in price-based measures (like the ATR) as well as implied figures (derived from options). It is possible for a single asset or currency to diverge from the norm for a while; but that is not a condition that can persist indefinitely. While it may not have to happen in the week ahead, the Greenback is very likely to break from its range between 97.70 and 95.80 soon. We can see the levels of activity are starting to seriously threaten the quiet normalcy when we consider the DXY Dollar Index’s technical range and its underlying activity. Below, we have the 20-day average true range (a good measure of activity) in red and the 50-day range as a percentage of the underlying currency’s price. This looks like a highly pressurized breakout risk.
Chart DXY Dollar Index with 20-day ATR and 50-day Historical Range (Daily)
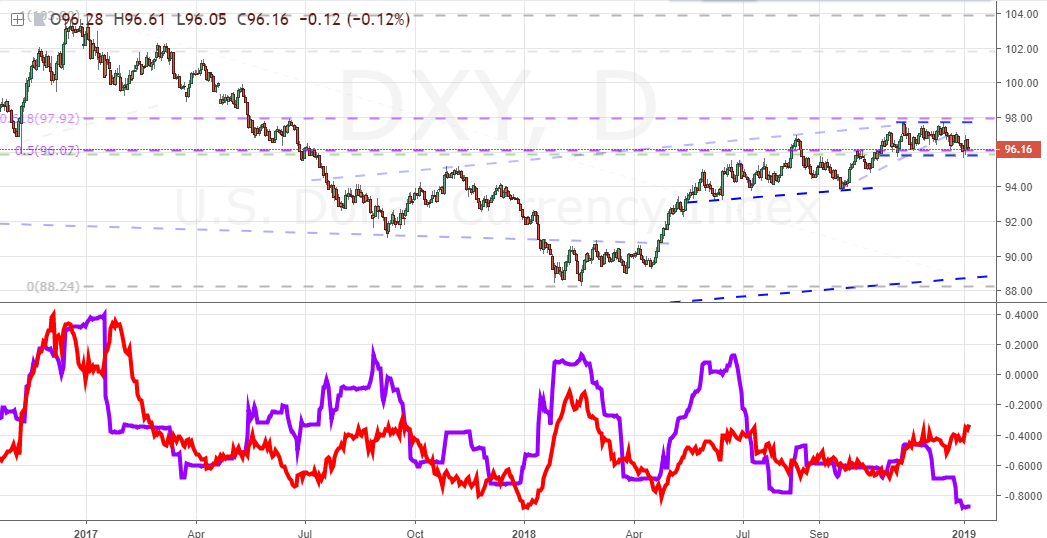
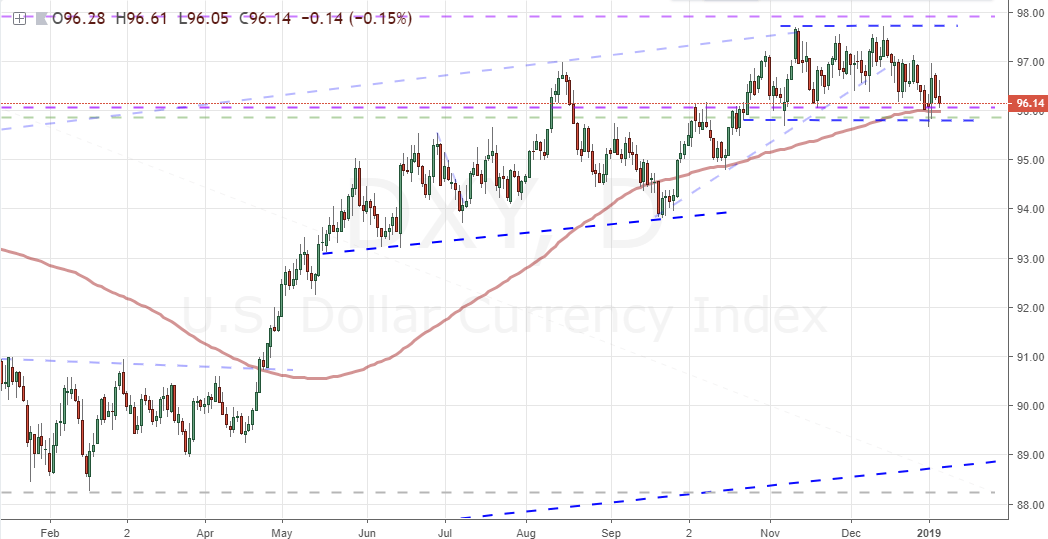
With pressure building, it isn’t difficult to spot the technical boundaries that will play as the milestones for the critical progress milestones. The 97.70 double top holds the thinner of the cumulative technical influence with just a 61.8 percent Fib retracement of the 2017-2018 bear wave standing just below 98. While the prevailing trend is still generally bearish since early 2018, progress has been increasingly difficult to facilitate. Breaks to extend the bullish progress have quickly faded into long bouts of congestion. That won’t halt the advance, but it will spell out difficulty for momentum should we continue with this prevailing trend. In contrast, the density of support is far more significant which would concentrate the response should it break. The range floor back to late October, 95.70 falls into the same vicinity as the 100-day simple moving average, the midpoint of the 2017-2018 range and the midpoint of the 2001-2008 historical range. Clearing that floor therefore will set off many alarm bells.
Chart DXY Dollar Index (Daily)
When looking at the Dollar’s various crosses, the natural reference for the DXY is its heaviest weighting in EURUSD. While generally a mirror of the index itself, this pair has far ‘cleaner’ technicals to work with. We have the same general proximity to the 100-day moving average, but the range high at 1.1500 is far more tangible and further fits the structure of an inverse head-and-shoulders pattern. As representative as the DXY is, the EURUSD is far more liquid; so look for technical cues for the currency at-large from this specific pair.
Chart EURUSD (Daily)

Though not as influential in sheer liquidity terms, there is no other pair more volatile for the Dollar than USDJPY this past week. The flash crash that spread through a host of currencies (Yen, Aussie, Kiwi, some emerging markets, etc) was not specifically focused on the Greenback. However, significant waves like this in the FX market or financial system in general can paint the depth of the US market as a particularly attractive harbor for capital. I will not put much trust into the technicals that have developed around this flash crash volatility, but it nevertheless should be monitored for aftershocks in volatility as that can readily translate into volatility for the Dollar.
Chart of USDJPY (Daily)

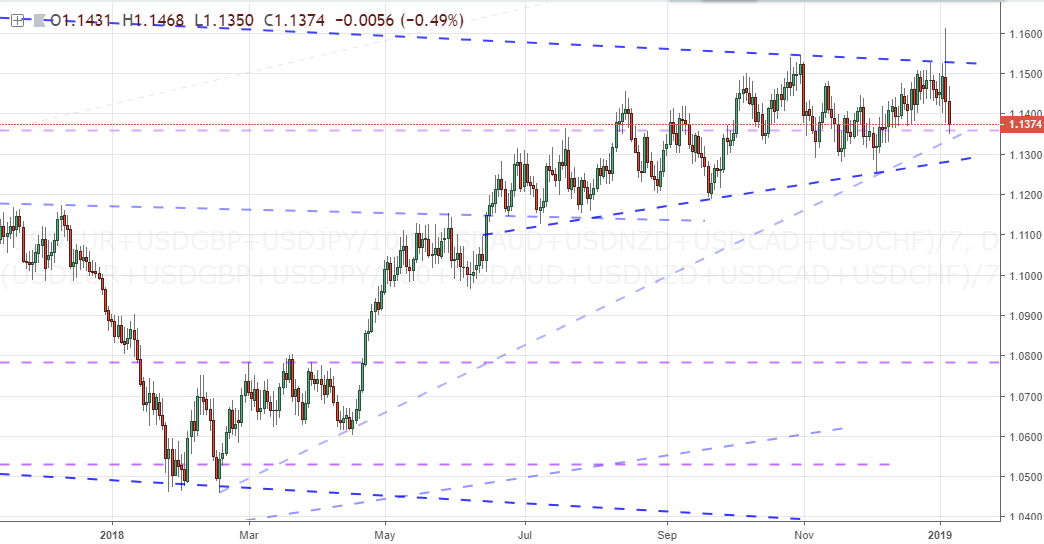
Taking away the concentration of the EURUSD or the unique focus on particularly volatile pairs, an equally-weighted Dollar Index shows the same degree of listlessness as the DXY – but materially more volatility. The pressure of the closing wedge over the past six months is overt and the head-and-shoulders pattern established through mid-December has given way to a symmetrical pattern with bouts of false breakout pressure – particular this past week’s charge. When volatility persists, ranges fall.
Chart of Equally-Weighted Dollar Index (Daily)
Considering the direction for the eventual break – not just the tentative technical spark but also the conviction for follow through bullish or bearish – it is important not to just reference the fundamentals. In fact, the motivations can be somewhat convoluted as we have seen Fed rate forecasts fade and hurt the carry appeal of the Dollar while at the same time risk aversion is boosting its safe haven role. What trait wins out in driving investor investment or divestment depends on bias. Yet, that bias can be skewed by the influence of existing exposure. The net speculative positioning behind the Dollar still sees a heavy net-long exposure that will be difficult to ratchet up such that traders want to materially escalate their exposure. However, if traders start to worry about this existing exposure, the need to exit always motivates more aggressively than the interest in building up new exposure.
Chart of Net Speculative Positioning in Dollar Futures Contracts (Weekly)

Other Weekly Technical Forecasts:
Australian Dollar Forecast: AUD/USD, AUD/CAD & EUR/AUD Prices Eye Technical Reversal Patterns


