


Talking Points:
- The Japanese Yen was once again the worst performing currency last week, but USD/JPY only gained +0.47% percent in the process.
- Buoyed risk appetite will favor the commodity currency crosses over the core developed currency crosses now that ‘hard Brexit’ fears have been stoked.
- Retail traders continue to buy the Yen on dips, suggesting that price losses are still likely in the near-term.
See our long-term forecasts for the Japanese Yen and other major currencies with the DailyFX Trading Guides.
Technical Forecast for the Japanese Yen: Mixed
The Japanese Yen had another rough week, diving deeper into the red across the board in September: AUD/JPY is now leading the pack, up by +2.83% on the month after gaining +2.59% between September 16 and 21 (the best performance among the JPY-crosses). Similarly, EUR/JPY added +1.54% last week and is now up by +2.69% on the month.
The ongoing improvement in risk appetite across the board is helping keep the Yen down. Fresh all-time highs in US equity markets, a breakout in the Nikkei 225, and another drift higher in sovereign bond yields in developed markets has investors dropping lower yielding currencies (CHF/JPY and USD/JPY) in favor of their higher yielding counterparts (AUD/JPY, CAD/JPY, and NZD/JPY). In an environment where stocks rally, particularly in Japan and the US, the Yen should remain generally weak; but now that ‘hard Brexit’ fears have started to materialize once again, pairs like EUR/JPY and GBP/JPY should lag behind.
USD/JPY Price Chart: Daily Timeframe (January to September 2018)
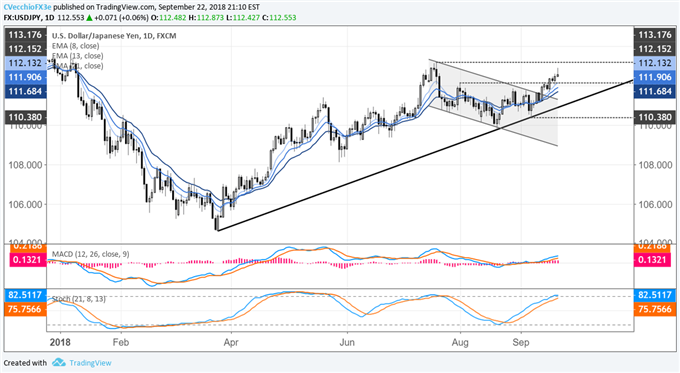
There was more topside follow-through over the past five days in USD/JPY following the breakout above the downtrend from the July 19 and September 5 highs. On September 18, price closed above the August 1 swing high at 112.15, in the process triggering a targeted return to the July high at 113.18. Price is still above its daily 8-, 13, and 21-EMA envelope, and both daily MACD and Slow Stochastics trend higher above their respective signal or neutral lines, the near-term outlook for USD/JPY remains bullish.
The shooting star/hammer on Friday, however, warns that the current bullish may be tested in the coming sessions; a move below the daily 8-EMA, which provided support for the September 18 bullish outside engulfing bar, would invalidate the near-term bullish outlook.
GBP/JPY Price Chart: Daily Timeframe (January to September 2018)
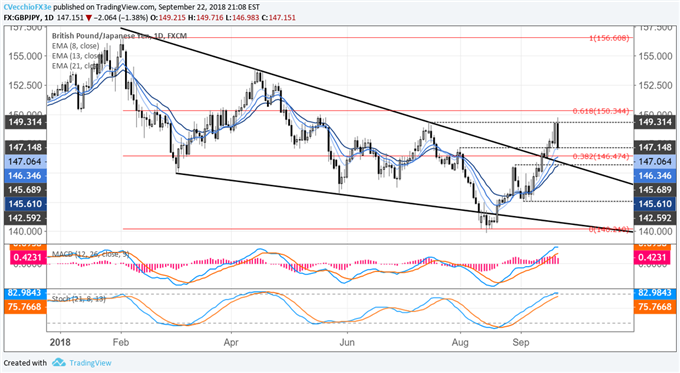
GBP/JPY’s breakout last week was moving along unencumbered, clearing the August 1 high at 147.15, triggering the upgraded outlook for a move into the July high near 149.31. While the July high was indeed achieved, price action on Friday, September 21, suggests that the near-term outlook has changed. Even though price remains above its daily 8-, 13, and 21-EMA envelope, the bearish outside engulfing bar at the end of the week neutralizes near-term bullish momentum.
To this end, both daily MACD and Slow Stochastics remain above their respective signal or neutral lines, but have started to compress and turn lower. Considering that the catalyst for the turn – fears of a ‘hard Brexit’ – aren’t likely to die down in the coming week, GBP/JPY’s previously bullish outlook must be downgraded to neutral.
EUR/JPY Price Chart: Daily Timeframe (January to September 2018)
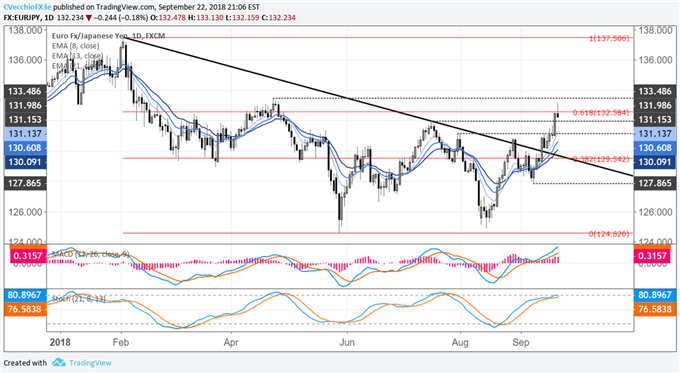
EUR/JPY showed follow-through on its breakout attempt, fulfilling its bullish impulse higher by running into its highest level since April 26, in the process clearing out the August 1 high at 131.15. EUR/JPY continues to hold above its daily 8-, 13, and 21-EMA envelope, and both daily MACD and Slow Stochastics trend higher above their respective signal or neutral lines. Price gains on Friday were cut down to end the session with a shooting/star hammer, suggesting that the run up to the July high near 131.99 may not be achieved so easily in the near-term. A move below the daily 8-EMA would invalidate the near-term bullish outlook, as EUR/JPY hasn’t closed below its daily 8-EMA since September 10.
FX TRADING RESOURCES
Whether you are a new or experienced trader, DailyFX has multiple resources available to help you: an indicator for monitoring trader sentiment; quarterly trading forecasts; analytical and educational webinars held daily; trading guides to help you improve trading performance, and even one for those who are new to FX trading.
OTHER TECHNICAL FORECASTS:
Australian Dollar Forecast: AUD/USD Eyes Key February Trend Line as EUR/AUD Prolongs Reversal
Euro Forecast: Looking for Euro Breakout to Hold
US Dollar Forecast: Dollar Triggers a Technical Breakdown, Will Bears Show Up?
Equity Forecast as Risk-On Takes Hold: S&P 500, Dow, DAX, FTSE and Nikkei
--- Written by Christopher Vecchio, CFA, Senior Currency Strategist
To contact Christopher, email him at cvecchio@dailyfx.com
Follow him in the DailyFX Real Time News feed and Twitter at @CVecchioFX.


