


Bitcoin, Ethereum Talking Points:
- Both Bitcoin and Ethereum continue to grind away at support.
- Bitcoin put in a probe of the 40k psychological level last week but has since held support a little higher on the chart.
- The analysis contained in article relies on price action and chart formations. To learn more about price action or chart patterns, check out our DailyFX Education section.

Both Bitcoin and Ethereum spent another weekend grinding away at support. And given the announcement from last week, with China making crypto activities illegal, the fact that there wasn’t a larger sell-off is likely a fact celebrated by crypto bulls.
In both major cryptocurrencies, a big spot of support is in place. In alt coins such as Cardano or Dogecoin, that support looks a little less solid. Solana, however, remains of interest after the astounding run from August and September.
Bitcoin (BTC/USD)
In Bitcoin support remains in the zone running from Fibonacci levels at 41,628 and 42,588. Last Tuesday did see the 40k psychological level get tagged, but this was before the China announcement and since then support has held a little higher, in the aforementioned zone between Fibonacci levels. Resistance is holding in from a group of prior swing lows, from around 44,857.
At this point the most bullish item about Bitcoin price action is the support hold. There’s no sign yet that momentum is changing into a more bullish state, but a test above that resistance can start to re-open the door to topside approaches.
Bitcoin (BTC/USD) Daily Price Chart
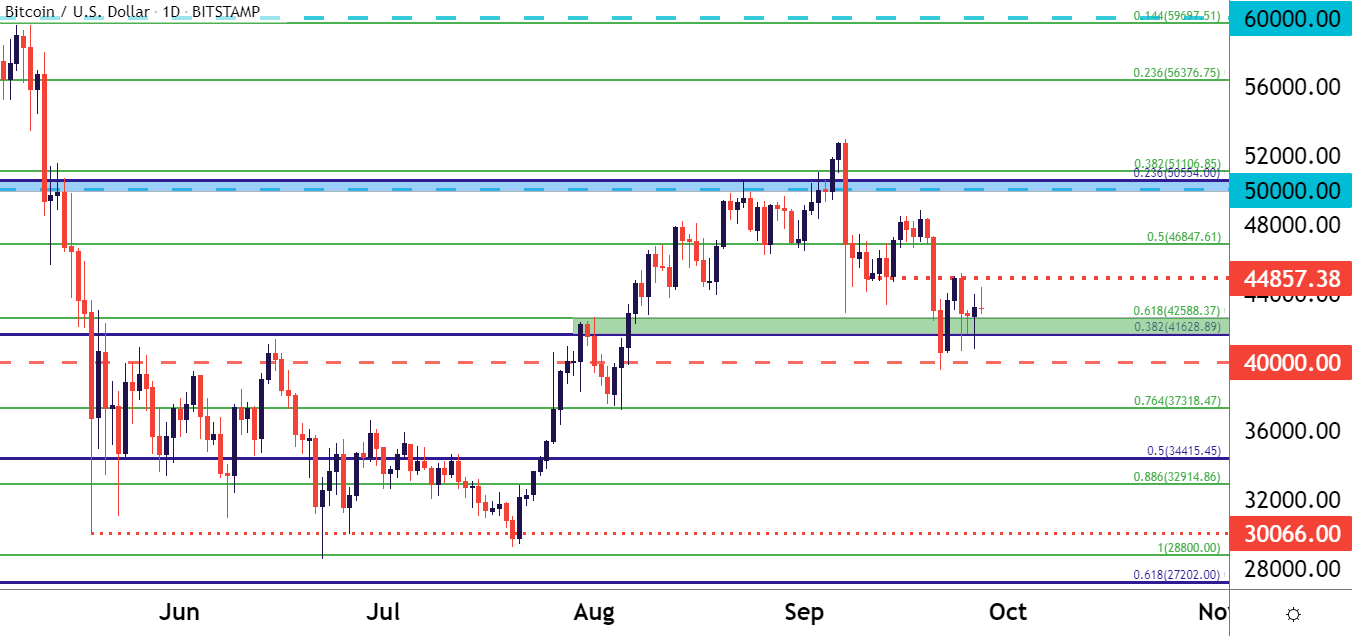
Chart prepared by James Stanley; Bitcoin on Tradingview
Ethereum (ETH/USD)
While Bitcoin is really buried into that support at the moment, Ethereum has been more range-bound of recent and as of this writing, price is not quite close to range support. In the middle of that range is a zone of prior support/resistance, and this is currently functioning like a mid-line in the move. Resistance has been around 3,163 and support around 2,731.
Similar to Bitcoin above, there’s no sign yet that bullish momentum is set to return as we’ve been mired in mean reversion for about a week now. But, a breach of resistance opens the door for a re-test of the longer-term zone, around 3,279-3,333.
To learn more about Fibonacci, check out DailyFX Education
Ethereum Four-Hour Price Chart
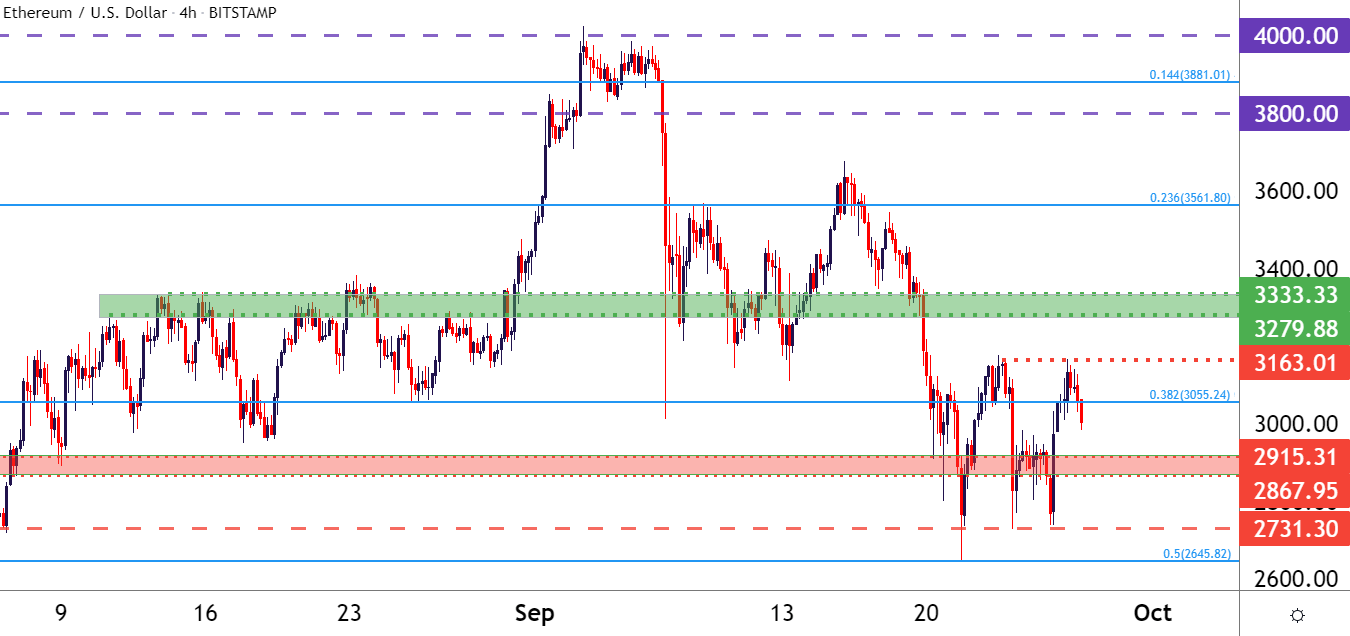
Chart prepared by James Stanley; Ethereum on Tradingview
--- Written by James Stanley, Senior Strategist for DailyFX.com
Contact and follow James on Twitter: @JStanleyFX


