


Bitcoin (BTC/USD) Forecast:
- Bitcoin dances with Fibonacci support
- BTC/USD range-bound despite regulatory concerns
- What will Q3 hold for major cryptocurrencies?
Bitcoin (BTC/USD) has experienced a year of turbulent moves so far, driven by crowd psychology, fear and market sentiment. Although the initial rally began in October last year, former Bitcoin enthusiast and self-proclaimed ‘Dogefather’ Elon Musk has played a major role in provoking crypto volatility, which currently remains suppressed.
The analysis contained in article relies on price action and technical analysis. To learn more check out our DailyFX Education section.
With low interest rates supporting demand for higher portfolio returns, cryptocurrencies became popular amongst both retail and institutional investors, supporting the bullish narrative that captivated headlines throughout the first quarter of this year.

However, after achieving fresh, consecutive all-time highs for four consecutive months, BTC/USD reached a new record of $64,707 in April, bringing the exorbitant rise in crypto prices to a halt. In the aftermath, an increase in regulatory and environmental concerns has enabled sellers to drive BTC back towards the January low which continues to provide additional support at $28,780.
Bitcoin (BTC/USD) Technical Analysis
Bitcoin prices currently remain in a well-defined range, between key Fibonacci retracement levels of the 2020 move which continue to provide support and resistance for the imminent move – see chart below. As prices continue to cling to the 8-day Exponential Moving Average, the Average True Range (ATR) - a measure of volatility - remains suppressed, supporting the range-bound momentum.

Bitcoin (BTC/USD) Daily Chart
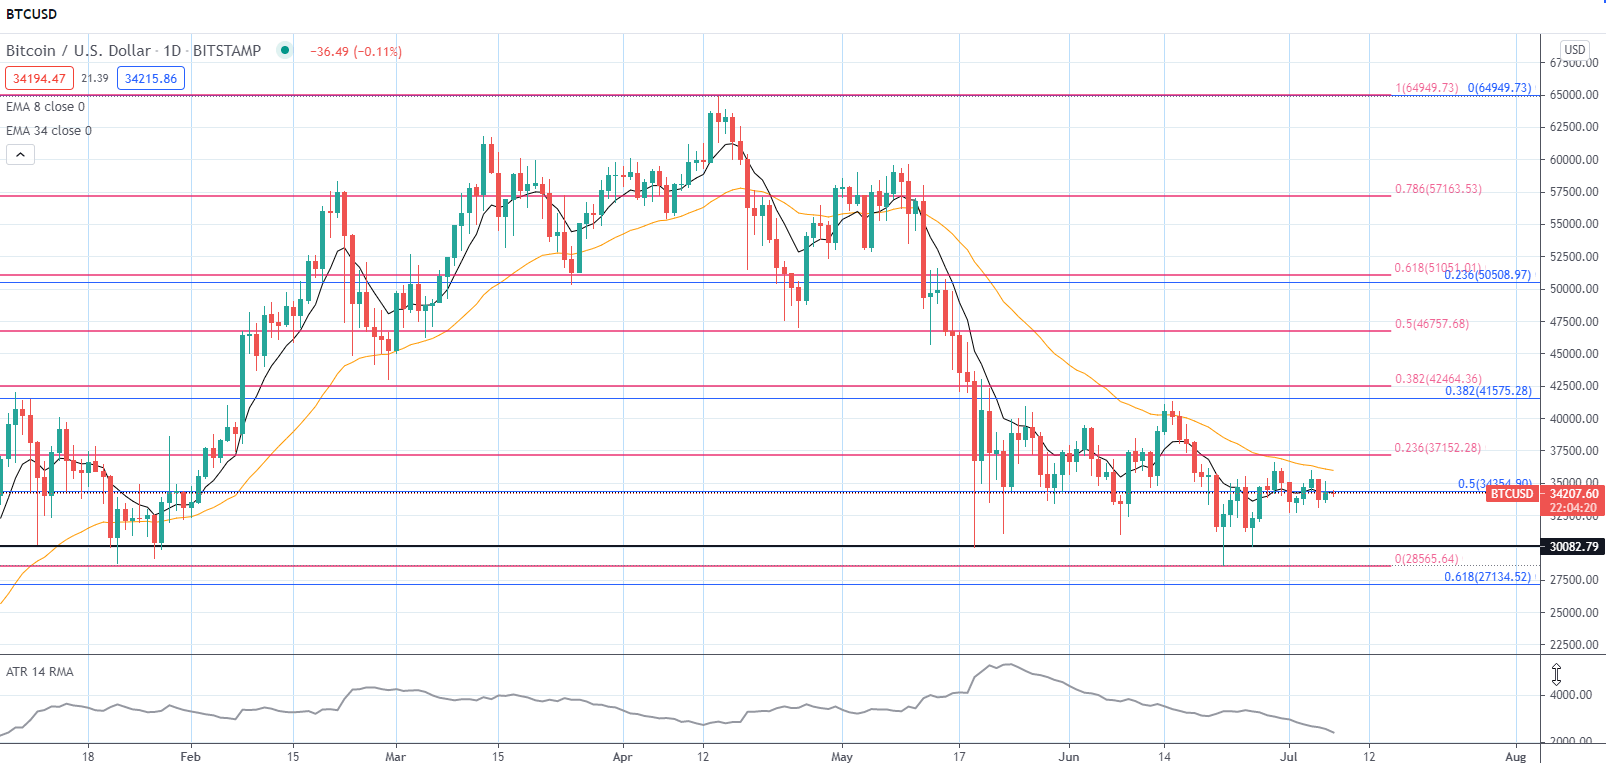
Chart prepared by Tammy Da Costa using TradingView
But, in order for bulls to gain traction, they will first need to break above the psychologically significant $36,000 handle, a hurdle that continues to hinder BTC/USD’s progression. However, should bulls succeed, the next resistance level that may hold is at $37,152, the 23.6% retracement of the 2021 move.
On the contrary, if selling pressure increases, bears will likely need to drive prices below support at $34,000 which could result in a drive towards $30,000.

--- Written by Tammy Da Costa on behalf of DailyFX.com
Contact and follow Tammy on Twitter: @Tams707


