


Bitcoin (BTC/USD) & Ethereum (ETH/USD) Price, Analysis and Chart:

Bitcoin is pushing higher this week but is finding $60k a tough level to break at the moment. BTC traded just a few dollars shy of this level today before selling-off, but if history repeats itself, this set-back will likely be bought and $60k will once again come under pressure. While the market continues to focus on the increasingly widespread adoption of Bitcoin, there remain legacy issues where the cryptocurrency was used for illegal activities with this week’s ruling by the CFTC on a massive Ponzi scheme the latest example.
Bitcoin in Focus as CFTC Issues $572 Million Fine for Crypto Ponzi Scheme
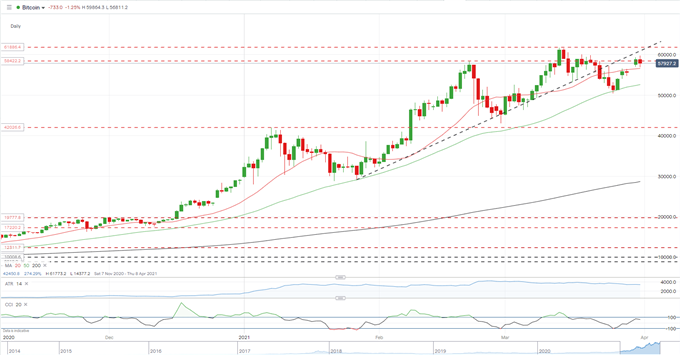
The chart set-up remains positive for Bitcoin with the old trend support line still pulling the price higher. This trend needs to be followed with a break and close above this line another bullish impulse for BTC. All three moving averages are supportive and with the 14-day ATR around $3,500, there is enough volatility in the market for a new high to be made quickly.
Bitcoin (BTC/USD) Daily Price Chart (October 2020 – March 31, 2021)
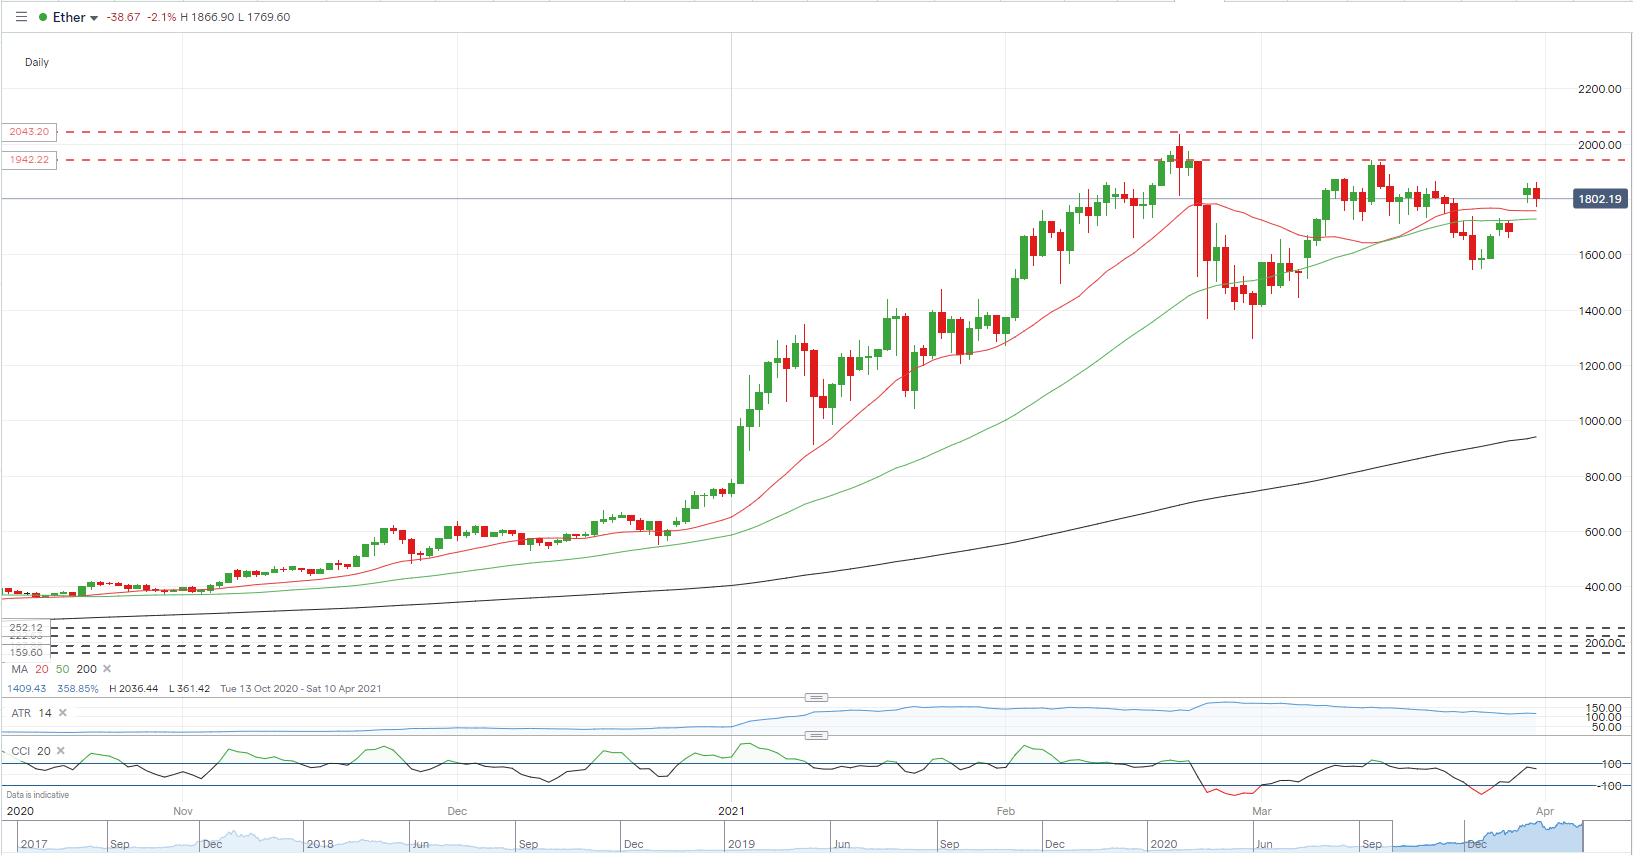
The price of Ethereum is being kept in check by the mid-March double print around $1,940 which is acting as a lower high off the February 20 high print at $2,043. The March print needs to broken and opened above to give Ethereum further bullish momentum and to set it up for a re-test of the February high. As with Bitcoin, all three moving averages are supportive while the ATR is drifting lower as recent restrictive price action keeps a lid on volatility.
Ethereum Daily Price Chart (October 2020 – March 31, 2021)
Traders of all levels and abilities will find something to help them make more informed decisions in the new and improved DailyFX Trading Education Centre
What are your views on Bitcoin (BTC) and Ethereum (ETH/USD) – bullish or bearish?? You can let us know via the form at the end of this piece or you can contact the author via Twitter @nickcawley1.


