


VIX INDEX SOARS, GOLD PRICES REBOUND, S&P 500 INDEX SWOONS AS RECESSION FEARS RESURFACE
- The VIX Index skyrocketed to a 1-month high as volatility measures jump in response to rising recession fears
- The price of gold jumped over 2% from month-to-date lows as the commodity catches bid from safe-haven demand while risk assets like stocks in the S&P 500 Index spiral lower
- Interested in forex trading? Check out our free educational guide on Forex for Beginners
The VIX Index – a popular barometer for investor fear, risk and uncertainty – has been on a tear higher as traders wrestle with the ballooning possibility that the US economy may be on the cusp of teetering into a recession. US recession fears were most recently reignited by a dismal ISM manufacturing PMI report published yesterday, which revealed the US manufacturing sector slipped deeper into contraction territory.
Aside from a surge in the VIX Index to start the fourth quarter, the market’s reaction was quite drastic across the board as the disappointing data fueled a major selloff in the S&P 500 Index and was accompanied by a solid rebound in gold prices. Interestingly, this puts us on pace with historical price action considering October is the most volatile month for US stocks with an average VIX of 21.7 since 1990.
VIX INDEX PRICE CHART: WEEKLY TIME FRAME (APRIL 03, 2017 TO OCTOBER 02, 2019)
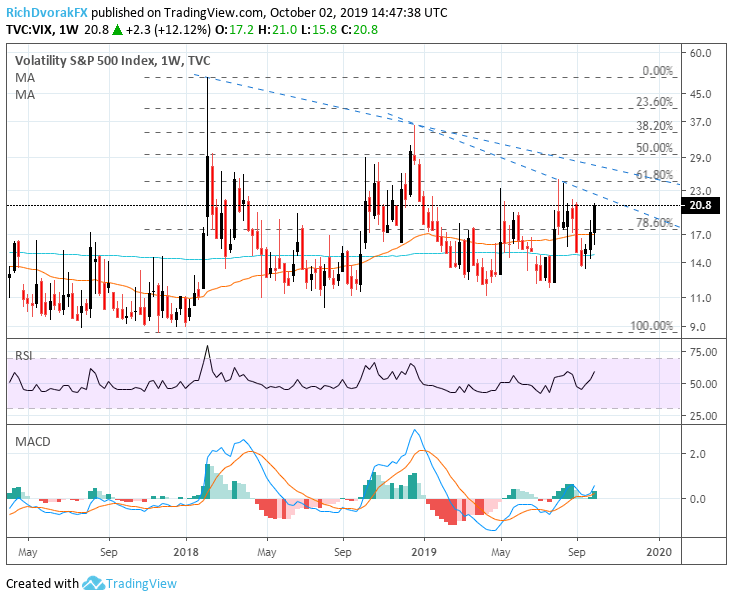
Chart created by @RichDvorakFX with TradingView
The VIX Index is currently trading comfortably above the 20.0 handle after smashing through confluent resistance posed by the 17.0 price level, which is underscored by the 78.6% Fibonacci retracement of its “volmageddon” spike back in February last year. It seems that volatility has been on a slow-and-steady rise since printing an all-time low of 9.14 back in November 2017 judging by its subsequent series of higher lows. However, the VIX Index has also recorded a series of lower highs at the same time.
This brings the overarching downtrend resistance lines into focus and could keep further upside in the VIX Index at bay. Although, upward momentum could very well keep chugging along as hinted at by the bullish RSI and MACD. Moreover, prior resistance turned support could help keep the VIX Index and cross-asset volatility measures broadly afloat.
VIX INDEX PRICE CHART: DAILY TIME FRAME (SEPTEMBER 27, 2018 TO OCTOBER 02, 2019)
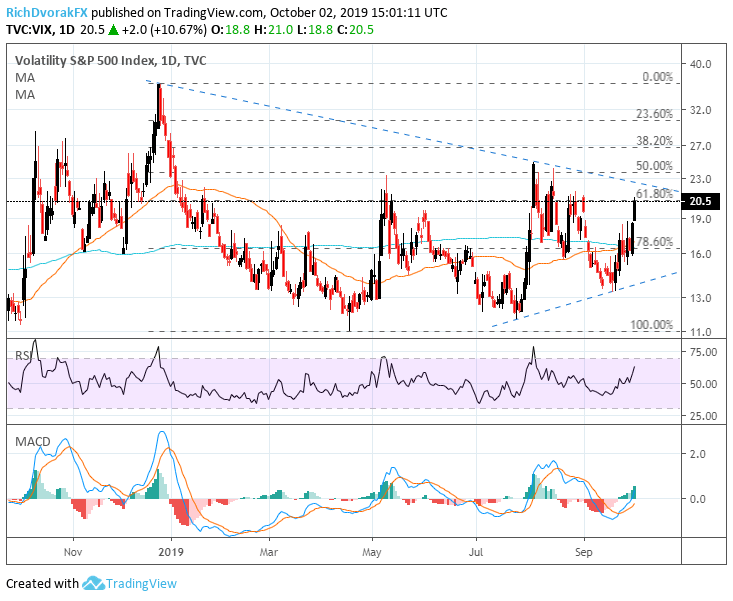
Chart created by @RichDvorakFX with TradingView
I must say the parallels to last October are eerily similar to the current fundamental backdrop regarding the domineering market theme of trade wars and its contribution to slowing global GDP growth. Apart from the US-China trade war, which still seems far from over, President Trump was just given the green light by the World Trade Organization (WTO) to look across the Atlantic and levy tariffs on up to $7.5 billion of goods imported from the EU. This newly opened trade war front is in addition to the outstanding auto tariff decision that was delayed back in May.
Although the latest manufacturing PMI data does give traders reason to be sitting on the edge of their seats and feeling anxious about rising recession probabilities, America’s manufacturing sector only comprises roughly 15% of the US economy. As such, shifting focus away from the manufacturing data toward the upcoming ISM services/non-manufacturing PMI and nonfarm payrolls could provide markets with a better sense of whether ballooning recession fears should be given more credence or if the recent selloff in risk assets was overdone.
In addition to the upcoming high-impact data releases listed on the DailyFX economic calendar, traders will be forced to weigh the positive tailwind of two FOMC rate cuts and hopes for more Fed monetary policy accommodation down the road against the daunting downside risks faced by the US and global economy. At the very least, sustained readings of volatility at these high levels has potential to continue bolstering gold prices and dragging down stocks in the S&P 500 Index.
-- Written by Rich Dvorak, Junior Analyst for DailyFX.com
Connect with @RichDvorakFX on Twitter for real-time market insight


