


CRUDE OIL PRICES WILT AS OIL VOLATILITY GAINS AHEAD OF JACKSON HOLE
- Crude oil prices struggle to advance as commodity traders weigh recession fears against global stimulus hopes
- Oil price volatility, which could help gauge market uncertainty and risk appetite, rises into the kickoff of Jackson Hole
- Be sure to check out these Core Fundamentals of Oil Trading
Crude oil prices remain bogged down by lingering global recession fears most recently sparked by the 2s10s US Treasury yield curve inversion. Commodity traders remain juxtaposed between slowing GDP growth – largely stemming from persistent US-China trade war uncertainty – and central bank stimulus hopes that could shore up the stumbling global economy. As such, market participants remain puzzled over prospects for oil demand and crude oil prices.
Looking ahead, markets will likely watch for remarks out of the Jackson Hole Economic Symposium where the Federal Reserve is set to host a conference discussing the global economy and monetary policy outlook. Depending on whether or not Fed Chair Powell capitulates to the bond market’s lofty expectations for future accommodation largely stands to dictate where risk assets like crude oil prices head next.
CRUDE OIL PRICE CHART: DAILY TIME FRAME (APRIL 05, 2019 TO AUGUST 20, 2019)
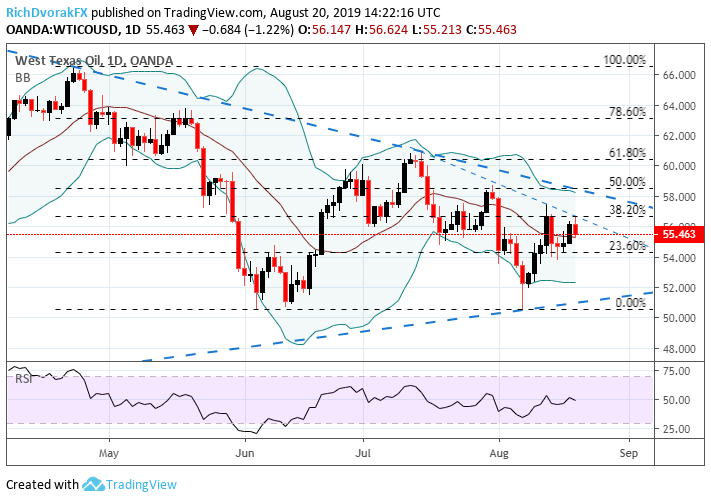
Chart created by @RichDvorakFX with TradingView
Turning to the daily crude oil price chart, we can see the possible formation of an inverted head-and-shoulder pattern. Yesterday’s gain in oil prices looks to have formed the pattern’s right shoulder and today’s 1.22% selloff appears to follow the neckline lower. Also, technical confluence around the 38.2% Fibonacci retracement level of the commodity’s April 23 high and August 7 low poses as resistance in addition to the short-term bearish trendline formed by the series of lower highs printed since mid-July.
OIL VOLATILITY INDEX PRICE CHART: DAILY TIME FRAME (DECEMBER 18, 2018 TO AUGUST 20, 2019)
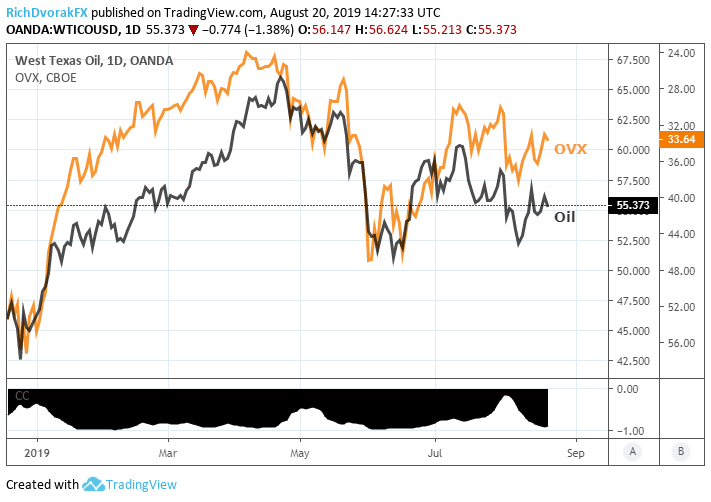
Chart created by @RichDvorakFX with TradingView
Oil volatility, measured via Cboe’s Oil Price Volatility Index (OVX), remains elevated as market uncertainty lingers. We highlighted last week’s crude oil price plunge amid raging recession fears owing to several sovereign yield curve inversions which seems to be keeping oil volatility (shown inverted above) elevated given their strong negative relationship. Consequently, traders could keep close tabs on OVX seeing that oil price volatility could gauge risk appetite. IG Client Sentiment, which reveals the bearish and bullish biases of retail traders, could also offer insight on where crude oil prices might head next.
CRUDE OIL – IG CLIENT SENTIMENT INDEX PRICE CHART: DAILY TIME FRAME (FEBRUARY 21, 2019 TO AUGUST 20, 2019)
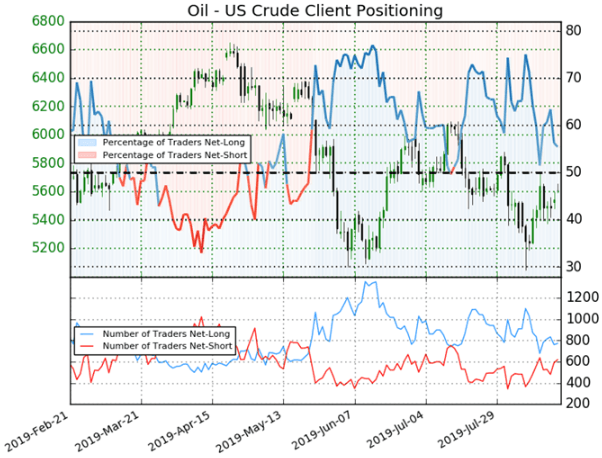
According to the latest IG Client Sentiment data, 55.5% of traders are net-long with the ratio of traders long to short at 1.25 to 1. The number of traders net-long is 8.7% lower than last week whereas the number of traders net-short is 6.5% higher over the same period. Seeing that we typically take a contrarian view to crowd sentiment and the fact traders are net-long suggests crude oil prices may continue to fall. However, it is worth noting that traders are less net-long andrecent changes in client positioning warn that the recent crude oil price trend may soon reverse higher.
-- Written by Rich Dvorak, Junior Analyst for DailyFX.com
Connect with @RichDvorakFX on Twitter for real-time market insight


