


VOLATILITY COULD GAUGE MARKET RISK APPETITE AS TRADE WAR UNCERTAINTY LINGERS
- Gold prices, stocks and volatility whipsaw in response to mixed messaging on the US-China trade war front in the midst of flashing recession indicators
- Watching the direction of volatility across asset classes could prove beneficial in gauging investor appetite for risk as market developments unfold
- IG Client Sentiment data can also provide unique insight into the bullish or bearish bias of traders
As market fear and certainty rise, typically so does volatility. Such has been the case so far this month driven by the latest US-China trade war drama and signals from closely watched recession indicators like the 2s10s yield curve inversion which alarmed traders. Nonetheless, stocks are back on the climb as the dust settles following President Trump’s tariff delay announcement. With stocks in the S&P 500 Index attempting to stage a recovery from the steep slide recorded earlier this month – just days after the Federal Reserve cut rates for the first time in a decade at its July FOMC meeting – volatility is receding while gold prices drop.
S&P 500 INDEX REBOUNDS AS VOLATILITY RECEDES
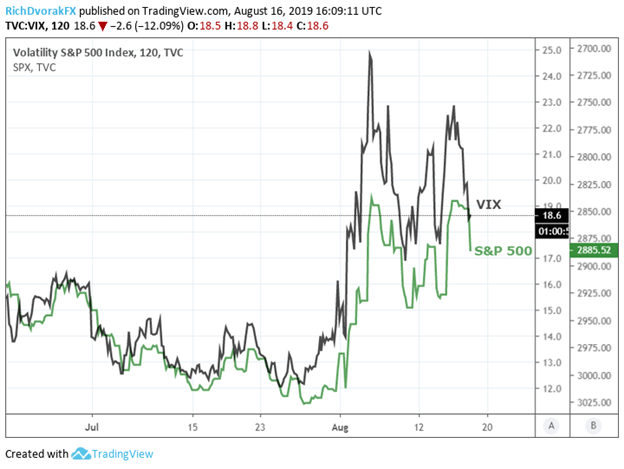
Chart 1: Inverted S&P 500 Index Price and VIX Index Price – created with TradingView
That said, the US-China trade war could escalate once more at any given moment (like with an unexpected Tweet by President Trump). Markets could expect volatility, measured using Cboe’s VIX Index, to skyrocket back higher under this scenario. Similarly, a jump in the VIX Index could be mirrored by a major selloff in risk-assets like stocks in the S&P 500 Index. Also, worth noting is how stock market selling pressure could be exacerbated by further investor bearishness and worsening sentiment if slowing global GDP growth fears are rekindled or unwelcomed monetary policy decisions are hinted at by central bankers.
This is already evidenced by the massive S&P 500 ETF fund exodus in the month-to-date as Main Street grows increasingly pessimistic about bullish prospects for US equities. To keep tabs on a major catalyst that has potential to debase risk appetite and spark a selloff in the S&P 500, traders could watch price action in emerging markets along with USDCNH and the PBoC’s Yuan Fixing as a US-China Trade War Gauge.
VOLATILITY IN EMERGING MARKETS ETF FOLLOWS EEM SELLOFF & USDCNH SPIKE
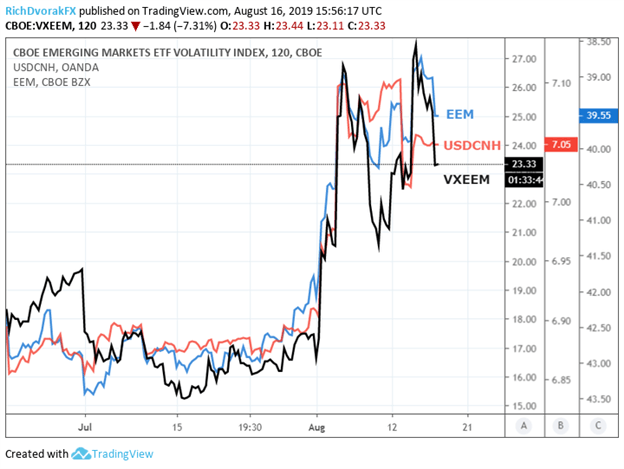
Chart 2: Spot USDCNH Price,Inverted Emerging Markets ETF EEM Price and VXEEM Index Price – created with TradingView
In response to Trump’s initial threat to add another 10% tariff tranche on $300 billion of Chinese goods, the PBoC – China’s central bank – cut the Chinese Yuan fixing against the US Dollar to offset its impact. As such, the offshore renminbi (traded as spot USDCNH) soared with the PBoC pegging the Chinese Yuan above 7. Yet, spot USDCNH remains comfortably above the 7.0000 price level still which suggests currency traders remain on edge over US-China trade war uncertainty.
At the same time, VXEEM, which tracks the 30-day implied volatility on the EEM Emerging Markets ETF, has receded quite a bit as selling pressure in EM stocks was alleviated with news that Trump’s added layer of tariffs are supposedly no longer going into effect this September. Likewise, the drop in VXEEM was also witnessed in GVZ – gold price volatility.
GOLD PRICES TEND TO FALL AS GOLD VOLATILITY DROPS
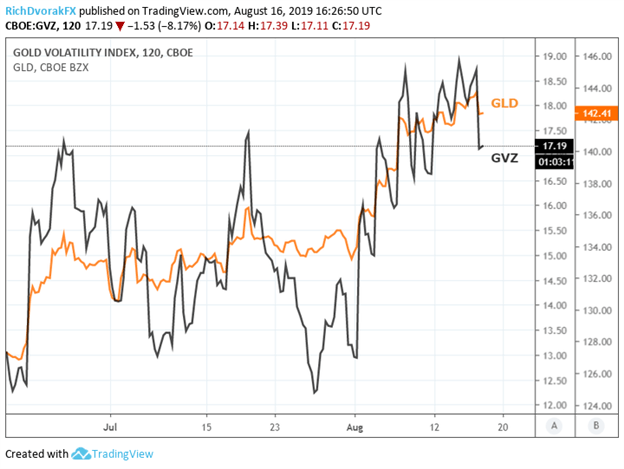
Chart 3: Gold ETF GLD Price and GVZ Index Price – created with TradingView
While falling volatility is typically beneficial for asset prices, that is not the case for safe-havens such as gold or US Treasuries. Gold prices have pulled back alongside a drift lower in volatility as risk appetite begins to recover owing to the recent US-China trade war de-escalation. Yet, the possibility that gold bulls remain in control of price action seems quite possible considering the influx of demand for anti-risk assets, like long dated US government bonds, which has sent yields plummeting.
US TREASURIES REMAIN BID AS TRADE WAR UNCERTAINTY LINGERS
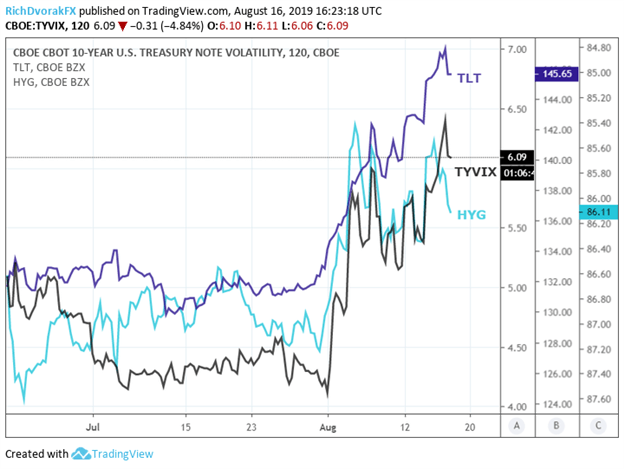
Chart 4: US Long-Term Bond ETF TLT Price, Inverted High Yield Corporate Bond ETF HYG Price and TYVIX Index Price – created with TradingView
In fact, investors have poured a net $4.8 billion into the long-dated US government bond TLT ETF as market participants seek safety. Also, demand for the riskier HYG ETF has subsided as financial conditions remain strained with traders on a US recession watch while interest rates plunge and several sovereign yield curves invert. That said, closely monitoring trader sentiment and the several gauges of volatility could prove beneficial in determining the market’s next direction.
-- Written by Rich Dvorak, Junior Analyst for DailyFX.com
Connect with @RichDvorakFX on Twitter for real-time market insight


