


US CHINA TRADE DEAL HOPES CRUSHES VOLATILITY ACROSS ASSETS
- Risk assets like stocks and crude oil soar following news that Trump and Xi agreed to a trade war ceasefire at the G20 Summit in Osaka, Japan over the weekend
- Volatility readings for several asset classes crumble in response and continue the downward trend sparked by expectations of looser monetary policy
- Traders could be blindsided by the Fed refusing to capitulate or if a US China trade deal fails to materialize as it has in the past
Volatility measures are plummeting for several asset classes such as US and EM equity markets, oil and gold prices, as well as for currencies and US10YR Treasuries. The sharp move lower in volatility comes in response to risk assets rising substantially on the back of positive developments out of the G20 Summit in Osaka, Japan over the weekend. The most prominent headline was US President Trump and Chinese President Xi deciding to scale back an escalating trade war between their two countries which comprise roughly 40 percent of global GDP.
VOLATILITY CHART OVERLAY OF GOLD, OIL, S&P 500, US TREASURIES, FOREX, EMERGING MARKETS: DAILY TIME FRAME (NOVEMBER 15, 2018 TO JULY 1, 2019)

The recent downshift in cross-asset volatility was initially sparked by hopes that central banks like the Federal Reserve (Fed) will cut interests rates to juice the economy to prevent further deterioration in already-weakening economic data. The recent spike lower looks like it could extend further as markets continue to digest more positive US China trade war rhetoric while Fed capitulation remains likely.
GOLD PRICE (XAUUSD) AND GOLD VOLATILITY (GVZ) CHART: DAILY TIME FRAME (NOVEMBER 15, 2018 TO JULY 01, 2019)

Spot gold was hit hard in particular immediately following the G20 Summit with XAUUSD dropping a whopping 1.61 percent as of mid-day Monday. Gold bears seized today’s risk-on mood as the commodity begins to show loss of appeal due to lack of safe-haven demand.
Gold price volatility – as measured by Cboe’s GVZ Gold Volatility Index – similarly swooned as the latest lack of market uncertainty looks to keep demand for gold subdued. Seeing the incredibly-strong correlation between gold volatility and spot gold prices, XAUUSD risks further weakness ahead. This is further suggested by a stark change in XAUUSD retail trader positioning with an increase in net-short positioning combining with a decrease in net-longs according to the latest IG Client Sentiment report.
US DOLLAR INDEX (DXY) AND US10YR TREASURY VOLATILITY (TYVIX) CHART: DAILY TIME FRAME (NOVEMBER 15, 2018 TO JULY 01, 2019)

The US Dollar has witnessed a strong rebound higher so far post-G20 Summit. A plausible explanation could be that the US economy may not experience as many headwinds owing to the latest deceleration in trade tensions with China. With an apparent ceasefire on the US China trade war, however, there may be reduced pressure on the Fed to cut rates later this month.
This has led to a repricing in the US Treasury market with interest rates on US debt climbing higher while investors flock away from the safety of bonds. The correlation between the US Dollar Index (DXY) and Cboe’s US10YR Treasury Volatility Index (TYVIX) could return to its generally-inverse relationship as US interest rates rebound and thus poses a material upside risk to the greenback.
S&P 500 INDEX (SPX) AND US STOCK MARKET VOLATILITY (VIX) CHART: DAILY TIME FRAME (NOVEMBER 15, 2018 TO JULY 01, 2019)

Traders’ favorite gauge of volatility – Cboe’s VIX Index – also plunged as risk assets like stocks celebrate the upbeat news out of the G20 Summit. In fact, the S&P 500 leapt to a fresh record high propelled by the latest influx of risk appetite.
Although, it is worth noting that investor complacency is a major threat to the global stock market.
If central banks refuse to capitulate to the lofty rate cut bets currency priced in by traders, equities risk experiencing pain ahead which could send volatility snapping back. Moreover, a sharp rise in VIX could send a ‘volatility shockwave’ across asset classes with a hawkish Fed potentially serving as the catalyst.
OIL PRICE (WTICOUSD) AND OIL VOLATILITY (OVX) CHART: DAILY TIME FRAME (NOVEMBER 15, 2018 TO JULY 01, 2019)
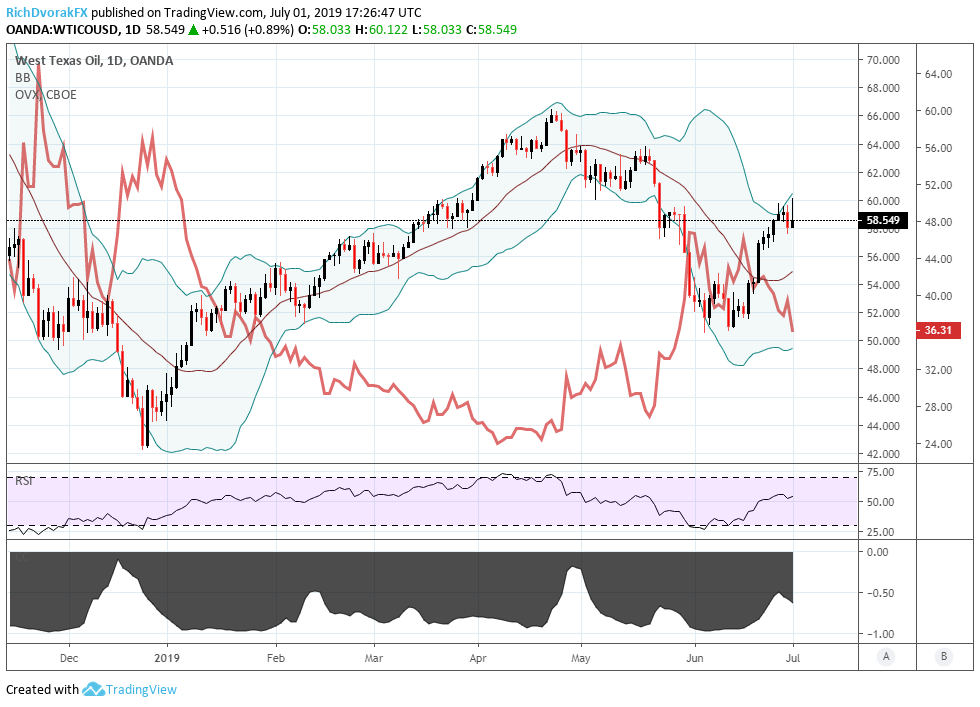
Likewise, crude prices (WTICOUSD) gained while oil volatility (OVX) extended its slide driven by comments from OPEC+ that the oil cartel and non-member countries agreed to extend production cuts in addition to the deceleration in trade war tension.
The one-two punch provided crude oil bulls with positive developments for continued upward momentum which is being slightly offset by news that the European Union’s INSTEX is officially online. With the rise in oil prices and decline in oil volatility, emerging markets fallout risk fades which is also implied by the steep drop in VXEEM – Cboe’s Emerging Markets ETF Volatility Index.
-- Written by Rich Dvorak, Junior Analyst for DailyFX.com
Connect with @RichDvorakFX on Twitter for real-time market insight


