


USD PRICE OUTLOOK: US DOLLAR BLEEDS LOWER AS GBP/USD & AUD/USD EXTEND SURGE, USD/CAD PLUMMETS
- US Dollar weakness continues as selling pressure sustained over the last five trading sessions steers the DXY Index 2% lower
- GBP/USD spikes 130-pips and claws back losses notched last month while spot AUD/USD extends its meteoric recovery from 17-year lows
- Spot USD/CAD nosedives and echoes the ongoing stretch of US Dollar downside against major peers
US Dollar bulls have failed to flex their muscles and allowed the popular safe-haven currency to weaken considerably over recent weeks. The DXY Index, a frequently cited basket of major currency pairs that reflects broader US Dollar performance, now trades 5% below its 20 March swing high. Though USD price action has surrendered most of its gains recorded earlier this year amid peak coronavirus panic, the US Dollar still boasts a 1% gain on balance year-to-date.

DXY INDEX – US DOLLAR PRICE CHART: WEEKLY TIME FRAME (OCT 2017-JUN 2020)
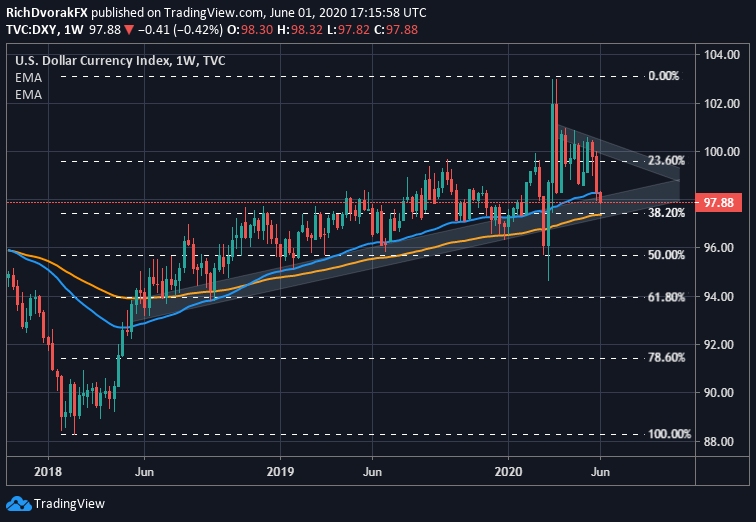
Chart created by @RichDvorakFX with TradingView
US Dollar selling pressure over recent weeks widely follows a prolonged wave of coronavirus optimism, which has catalyzed a sharp rebound in market sentiment and fueled the bearish blow to anti-risk assets like the USD. Despite mounting threats faced by the global economy, like the material possibility of a tangible breakdown in US-China trade relations, or glaring chance that coronavirus lockdown related job losses turn permanent, the US Dollar has failed to hold a bid as unfazed risk appetite crushes volatility.

Nevertheless, the US Dollar might face sustained headwinds while complacency builds and the DXY Index searches for technical support. Perhaps the 100-week exponential moving average, which is also underpinned by a key Fibonacci retracement level of the February 2018 to March 2020 trading range formed by the DXY Index, could provide an area of buoyancy for the US Dollar. On the other hand, there is potential that China tension escalating, violent protests erupting, and economic data releases upcoming might ignite a bullish reversal in the US Dollar.
GBP/USD & AUD/USD STILL SKYROCKETING AS USD/CAD CONTINUES DECLINE
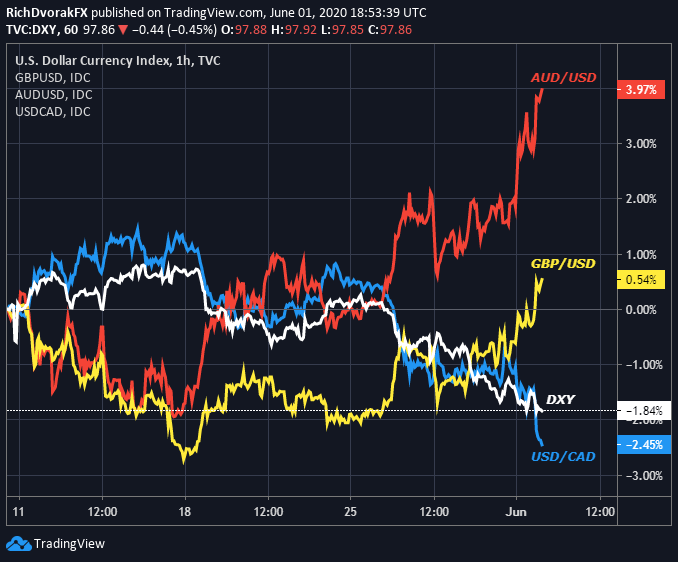
Chart created by @RichDvorakFX with TradingView
Since traders flipped their calendars to the new month, US Dollar weakness seems most notable against its GBP, CAD and AUD peers. The Australian Dollar keeps exploding higher as sentiment-linked AUD/USD soars another 130-pips, which looks like a continuation of the late-Friday rally following the Trump-China presser that revealed no new tariff threats, nor did Washington hint at wanting to scrap its phase one trade deal with Beijing.
| Change in | Longs | Shorts | OI |
| Daily | 2% | 3% | 2% |
| Weekly | 29% | -46% | 0% |
GBP/USD price action has gained similarly on the back of heavy US Dollar selling and rebound attempt off of last month’s lows put forth by the Pound Sterling. Spot USD/CAD continues to edge lower as well with the Loonie rising alongside crude oil.
US DOLLAR IMPLIED VOLATILITY TRADING RANGES (1-WEEK)
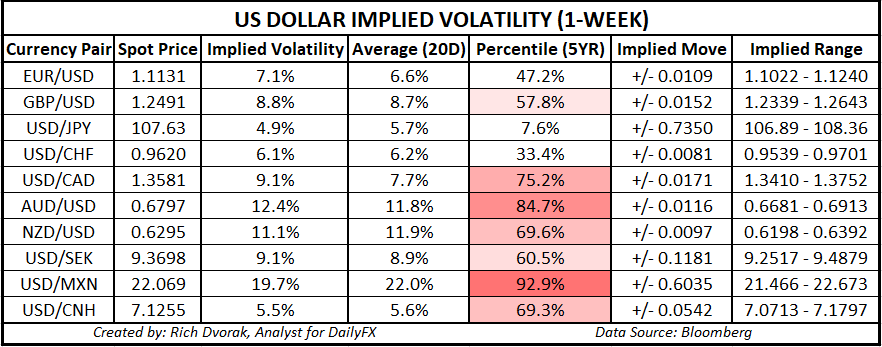
Looking later into the week, there are several outstanding themes and risk events scheduled lurking on the horizon with potential of stoking currency volatility. Implied FX volatility for select US Dollar crosses remains suppressed owing to a normalization of the latest volatility cycle, but easing market strain, in addition to the juxtaposition of bullish and bearish fundamental drivers, could provide possible range trading opportunities.

On that note, spot AUD/USD price action might steal the spotlight considering of the RBA meeting on deck for Tuesday, 02 June at 4:30 GMT. The Aussie-Dollar might react sharply to commentary from RBA Governor Lowe regarding Australian bond purchases and policies to control the yield curve. Meanwhile, there is the outstanding risk that AUD/USD price action could get a jolt from festering US-China trade war uncertainty festers or lingering coronavirus recession risk.
-- Written by Rich Dvorak, Analyst for DailyFX.com
Connect with @RichDvorakFX on Twitter for real-time market insight


