


Japanese Yen Technical Forecast Talking Points:
- The Japanese Yen is a ‘funding currency’ for the carry trade – a risk-oriented FX perspective that is as sensitive to sentiment as equities indices
- As the likes of the Dow slide, pairs like GBPJPY, CADJPY and NZDJPY retreat as appetite for the very low-yielding carry trades tumbles
- USDJPY is one of the more confusing Yen crosses given the Dollar’s own safe haven status, but EURJPY may be a good offset to this

Technical Forecast for Japanese Yen: Bullish
This past week has seen some serious traction on the risk aversion that has lurked in the markets through the past month. With benchmarks like the S&P 500 holding up through November against the broader tide, many macro market participants have pushed ahead with the assumption that speculative appetite was climbing unabated. Yet, a look at global indices, emerging market assets and FX-based carry trade has shown a very different picture. Measures of these markets have slid for a number of weeks, and this past week’s swell in volatility finally infecting the vaunted US indices has finally started to turn the complacent bulls off.
For the Yen crosses, this has finally turned USDJPY. The benchmark cross stalled after its impressive 115 bullish break which was driven by the Dollar’s rate forecast charge, and cut down the former resistance with the biggest single-day plunge since March 20, 2020 the week prior. While the slide continued this past week, it has done more to intensify the weight of support at 112.25/50. If risk aversion continues or the Fed forecast eases, a break through this former range resistance and 50 percent Fib of the past 6 year range will carry serious technical weight.
Chart of the USDJPY with 50-Day SMA (Daily)
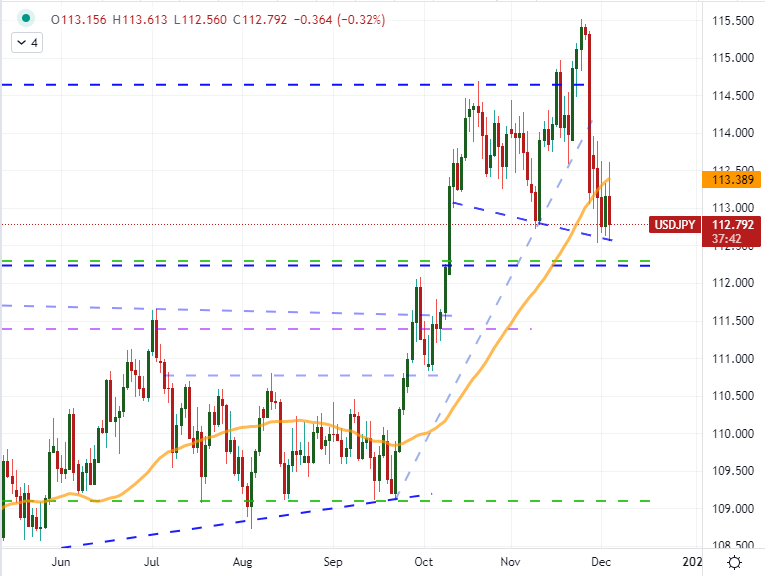
Chart Created on Tradingview Platform
One of the complicating factors of USDJPY is that both currencies are considered some form of ‘safe haven’. While the Yen is more sensitive in this case, the Dollar’s own attachment to the still-buoyant Fed rate forecast can create hiccups when trends could otherwise unfold. There are a few other crosses that have generous rate forecasts that are at risk should risk aversion continue like GBPJPY and CADJPY; but I like NZDJPY the most on this front. The cross this past week break below trendline support stretching back to last June. It is also somewhat stretched after a five-week descent with some range of support in the 76.00 to 74.00 area, but if risk aversion continues in earnest, this pair is far more straightforward.
Chart of the NZDJPY with 50-Week Moving Average (Weekly)
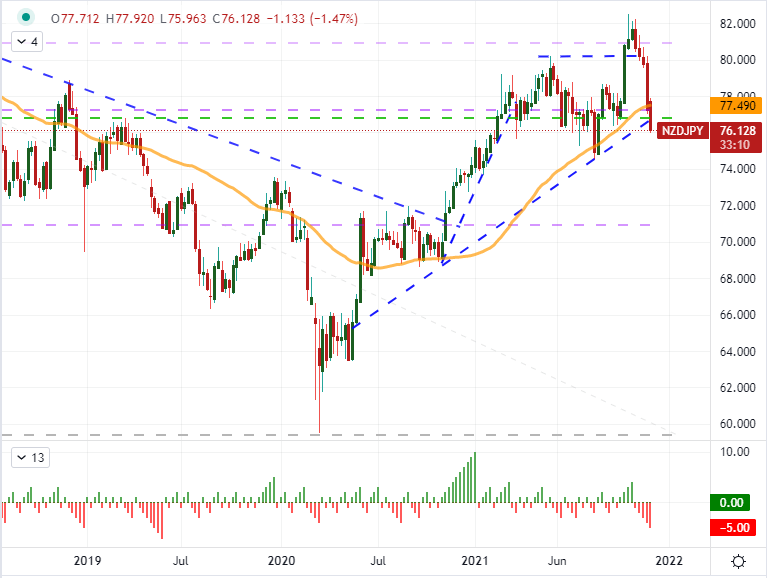
Chart Created on Tradingview Platform
Always holding open for alternative scenarios, I am also mindful if risk trends stabilize and recover in-line with seasonal expectations for December. If that were to occur, a bullish recovery is not likely to be particularly charged given the nature of liquidity. For that reason, the rebound on the likes of the NZDJPY wouldn’t be particularly well suited as interest rate expectations would also more likely be tamed. Taking the overt carry trade perception out of the equation, EURJPY hasn’t really traded with much in the way of strong rate expectations to leverage off of the Yen. If the persistent bearish trend of the past two months breaks with a move above 128.50, this is a well suited swing back into range.
Chart of EURJPY with 50-Day SMA (Daily)
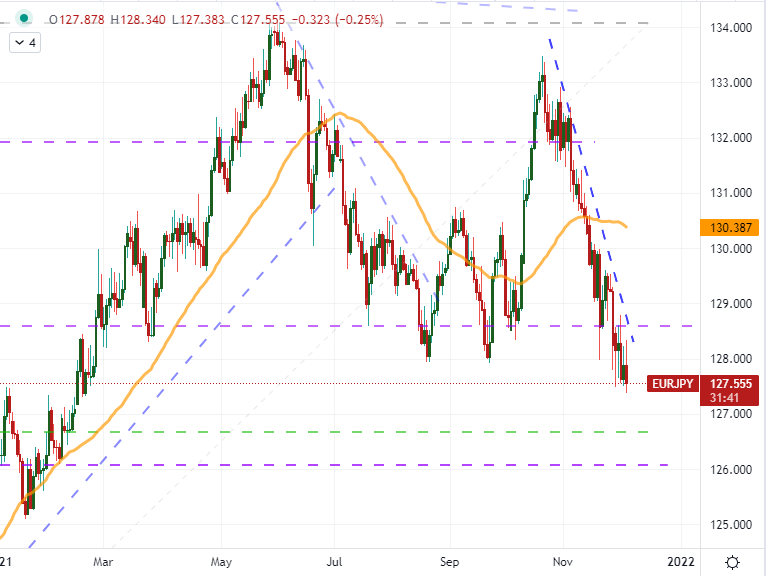
Chart Created on Tradingview Platform
Looking to speculative positioning, futures traders (via the CFTC’s COT report) shows that Yen positioning is starting to reverse from multi-year lows in a very correlated picture (inverted) to USDJPY price action on a weekly chart. There is still a heavy net long USDJPY view (approximately 80,000 contracts) that could readily fuel a faster retreat if technical hurdles are surpassed.
Chart of USDJPY Overlaid with Net Speculative Futures Positioning (Weekly)
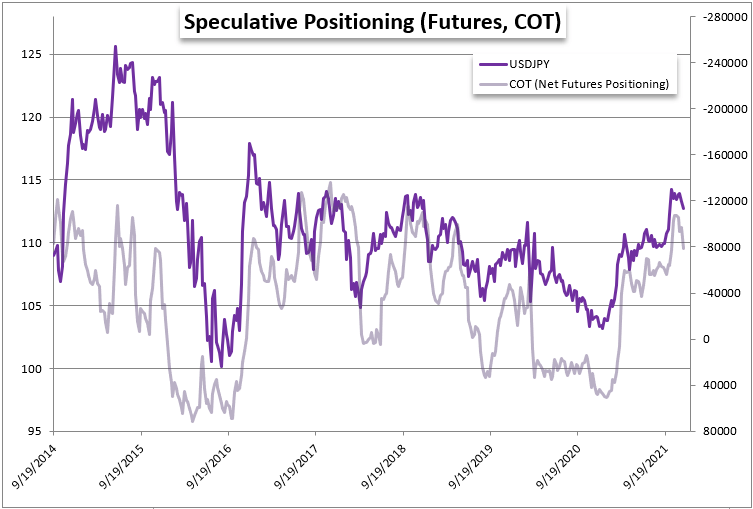
Chart Created on Tradingview Platform with Data from CFTC


