


US Dollar Talking Points:
- The US Dollar remains calm despite the global fireworks, with USD driving deeper into a symmetrical triangle pattern.
- I’m retaining a slight bearish bias longer-term on the USD but as always pair selection is of importance, and in this article I look at four major pairs of EUR/USD, GBP/USD, AUD/USD and USD/CAD.
- The analysis contained in article relies on price action and chart formations. To learn more about price action or chart patterns, check out our DailyFX Education section.
Trade Smarter - Sign up for the DailyFX Newsletter
Receive timely and compelling market commentary from the DailyFX team
Despite the fireworks across global markets the US Dollar has been downright tame. The currency continues its trendless February as price action has narrowed deeper and deeper into a symmetrical triangle pattern.
The next major driver in the headlines is the PCE release on the calendar for Friday morning but reasonably this formation is going to time out by then, as there’s simply no more space for the USD to coil deeper into the wedge. Adding to the intrigue is where this digestion is showing, as the triangle is centered around a longer-term spot of support/resistance that I’ve been talking about in these pieces since November of last year when it first started to come into play. The 95.86 Fibonacci level seems especially key, as this is the 50% marker of the 2001-2008 major move in the DXY index.
US Dollar Four-Hour Price Chart
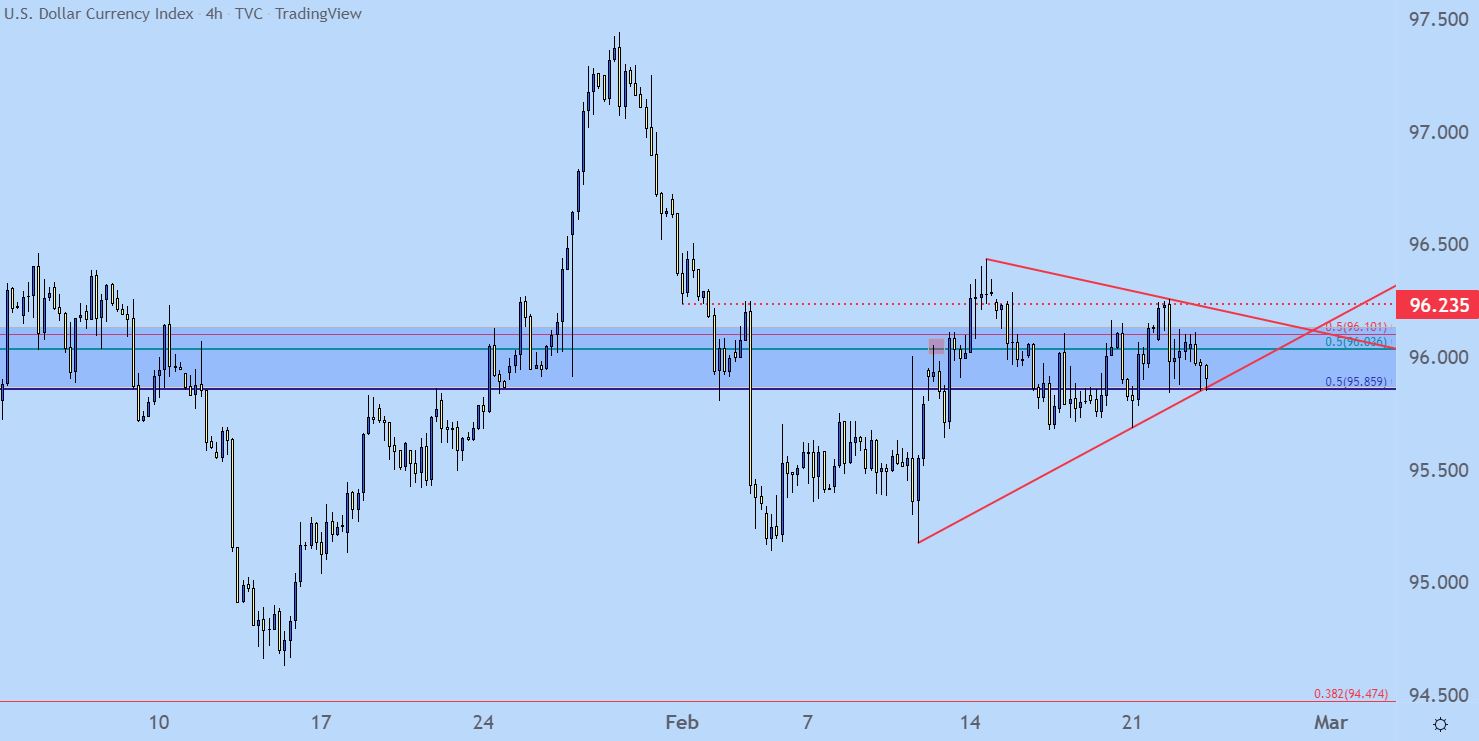
Chart prepared by James Stanley; USD, DXY on Tradingview
Taking a step back to give some longer-term definition to the matter and directional biases become even less clear, as this digestion has been showing in varying ways for more than three months now. And given the fundamental backdrop, in which the Fed has apparently shifted into an uber-hawkish mode in the effort of taming inflation that still continues to rise, and something is amiss.
This is why I would bias towards the bearish side on the USD right now, because quite a bit has happened over the past three months that should’ve prodded the long side of the currency – but it didn’t. And what else could happen to get bulls to breach resistance – is the Fed going to get even more hawkish - as a possible war ranges on in the background?
So, from a longer-term basis I continue to bias on the bearish side of the USD, largely from the lack of continuation despite the seemingly bullish fundamental backdrop that just hasn’t shown up yet. But, there’s still a bullish argument here as well and if the bearish side is going to fill-in with some element of reversal, then likely we’ll need to see some form of capitulation on the long-USD theme, which may pop up around this Friday’s PCE release. This could allow for a false break to the upside before reversal formations become more attractive, essentially looking to play a head-fake out of this very obvious symmetrical triangle.

US Dollar Weekly Price Chart
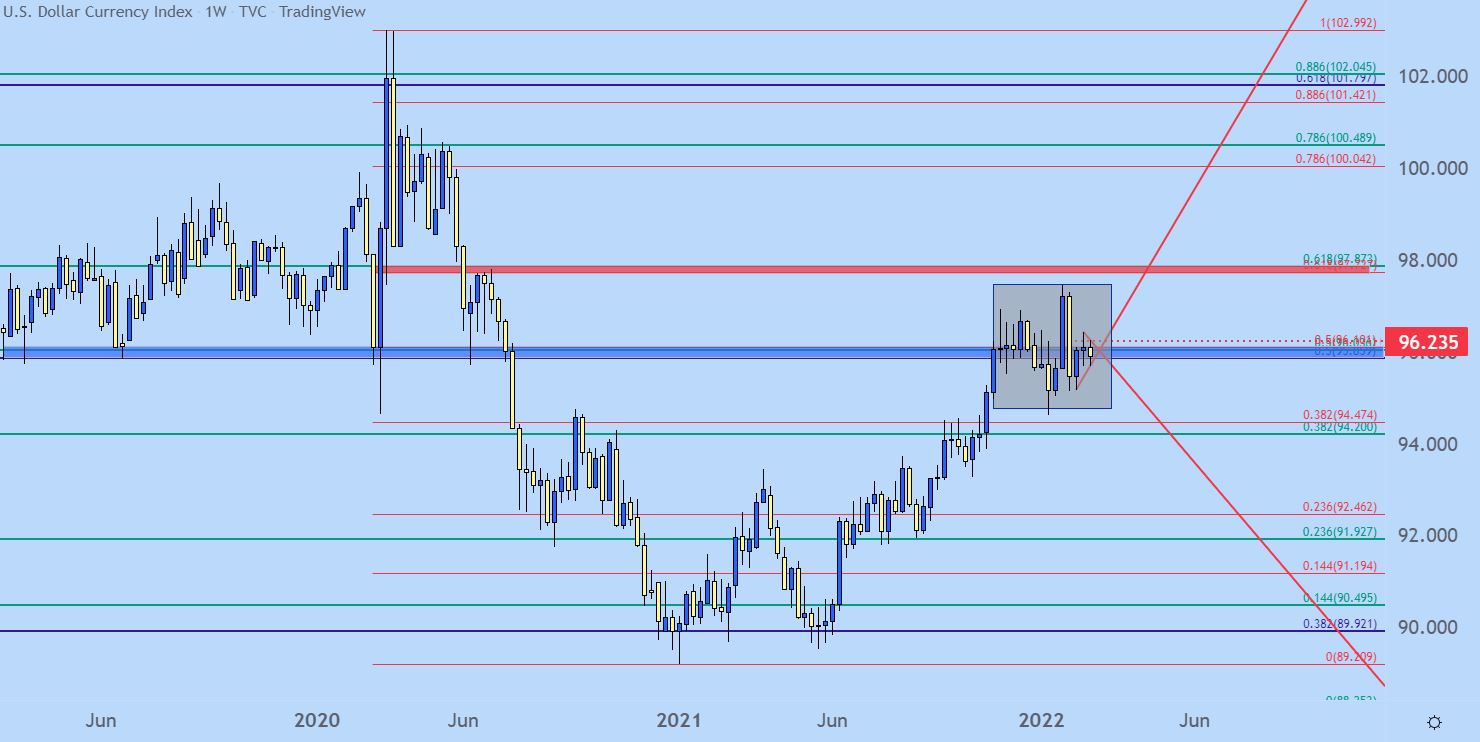
Chart prepared by James Stanley; USD, DXY on Tradingview
EUR/USD
Going along with that trendless US Dollar has been the mirror image in EUR/USD, and there’s been a similar tightening action showing here with price action coiling deeper into compression.
There’s a couple of trendlines at-play here and that goes along with existing support and resistance structure. The 1.1374 level remains relevant, and a breach there opens the door for a push up to 1409. On the support side, 1272 remains important, and tests below that open the door for longer-term support from 1187-1212.
EURUSD Four-Hour Price Chart
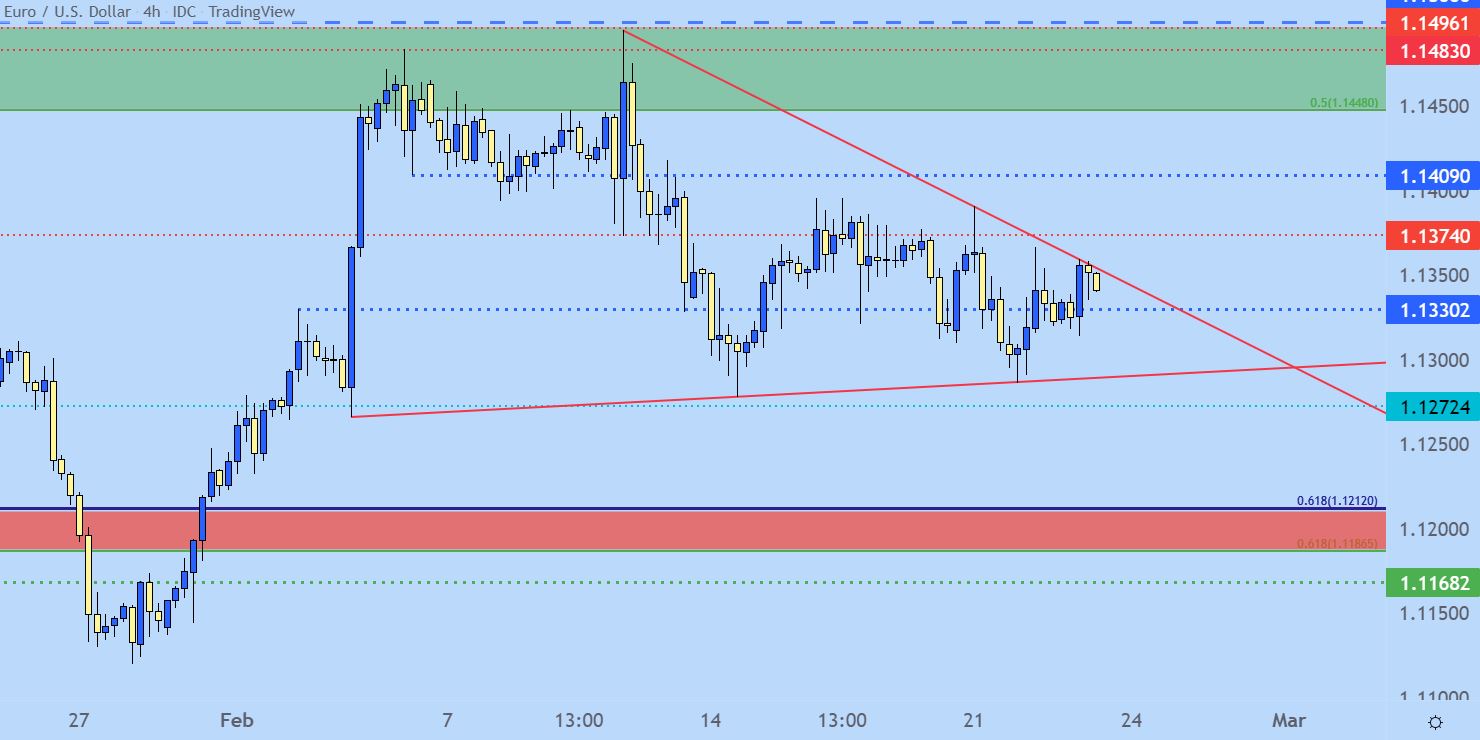
Chart prepared by James Stanley; EURUSD on Tradingview
GBP/USD Nasty Short-Term Price Action
I discussed this one in some depth for the weekend forecasts and much of that case remains the same. What I wanted to point out here is how utterly unattractive short-term price action has been in GBP/USD. There has been a semblance of mean-reversion, meaning range strategies can still hold some attraction here: But there’s been an absolute lack of trend of late and the fact that the door has seemingly been open for bulls, with the bull flag remaining in order, must be at least somewhat disconcerting on the long side.
But, as I wrote this weekend, a breach below the 1.3500 psychological level, marked with a daily candle close through that price, can open the door for reversal scenarios.

GBP/USD Daily Price Chart: Stick Sandwich
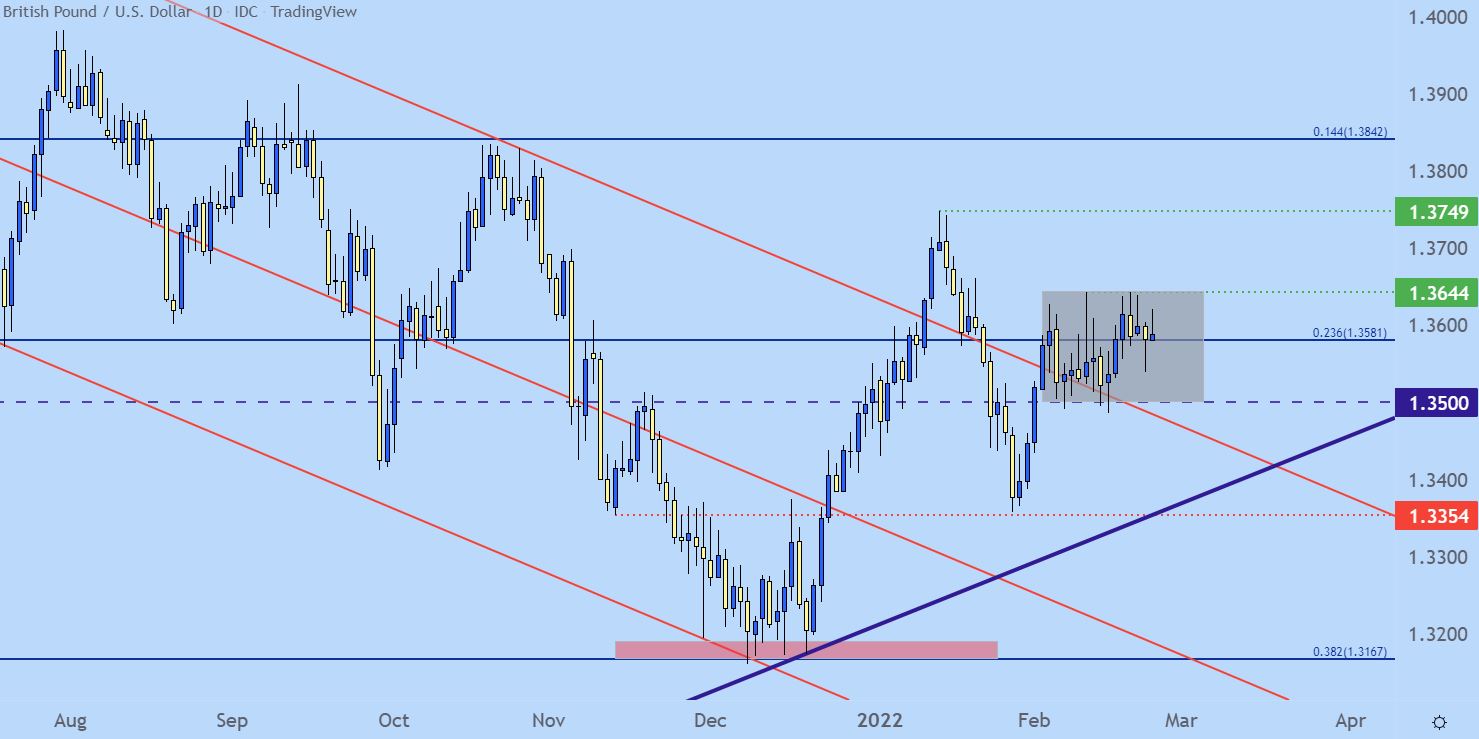
Chart prepared by James Stanley; GBPUSD on Tradingview
AUD/USD Breaches Wedge
On the short side of the US Dollar I’ve been following AUD/USD.
There was some healthy longer-term construction here for reversal scenarios as the pair had built-in support off of the familiar psychological level at .7000. That allowed for the formation of a falling wedge, which is often approached with the aim of bullish reversals.
Over the past week bulls continued to push through the resistance portion of that formation, finally making way yesterday and getting some extension on the move this morning, crossing the 7250 psychological level. This keeps the door open for bullish continuation and 7250 now becomes short-term, higher-low support potential.

AUD/USD Daily Price Chart
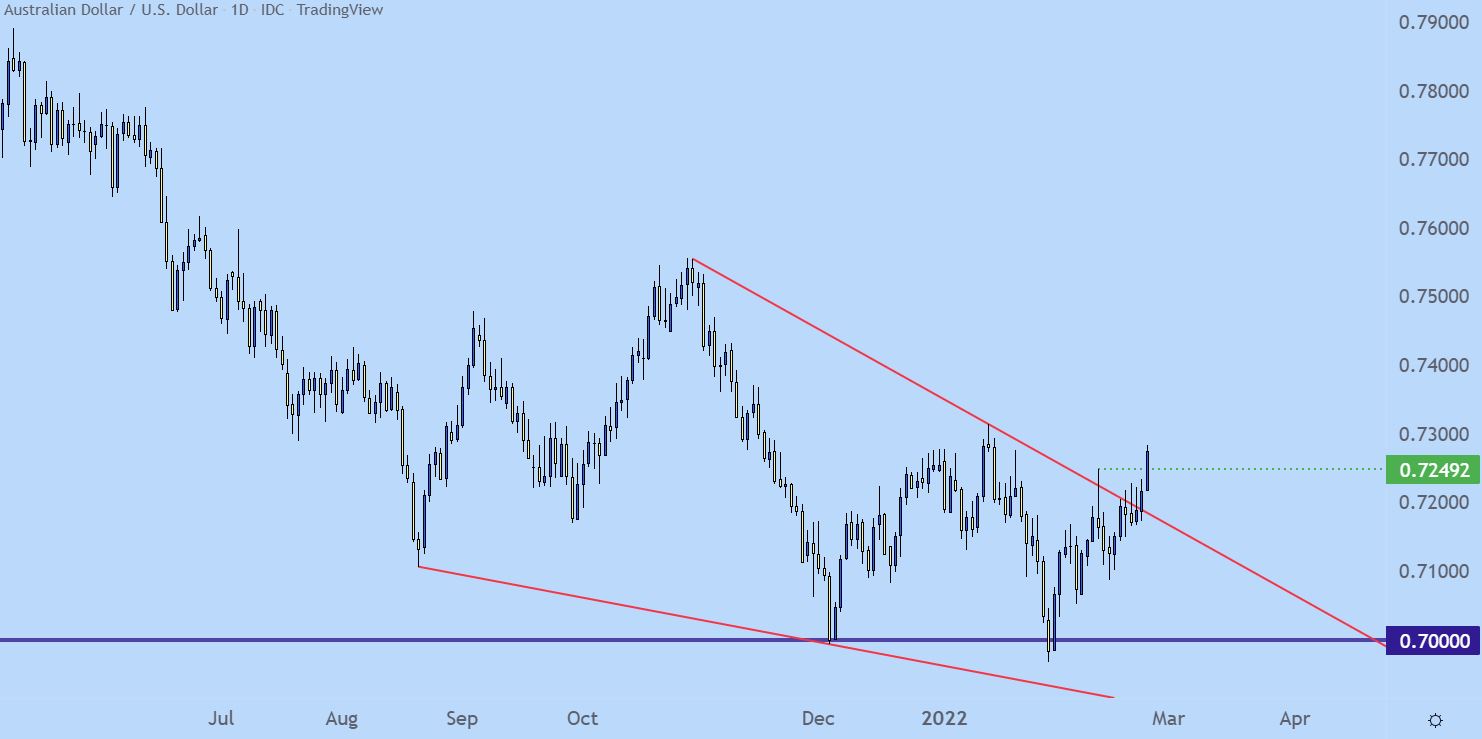
Chart prepared by James Stanley; AUDUSD on Tradingview
USD/CAD Textbook Range Gets Another Turn
I’m currently in the process of creating some education content and yesterday I remarked in one of those pieces how the current setup in USD/CAD has pretty much been a textbook range.
This has been building for all of February and there’s been multiple runs to either side of the formation. Most recently resistance was in-play yesterday. And sellers have taken their swing, pushing towards support starting at the 2672 area of the chart with resistance beginning about 100 pips higher.

USD/CAD Two-Hour Price Chart
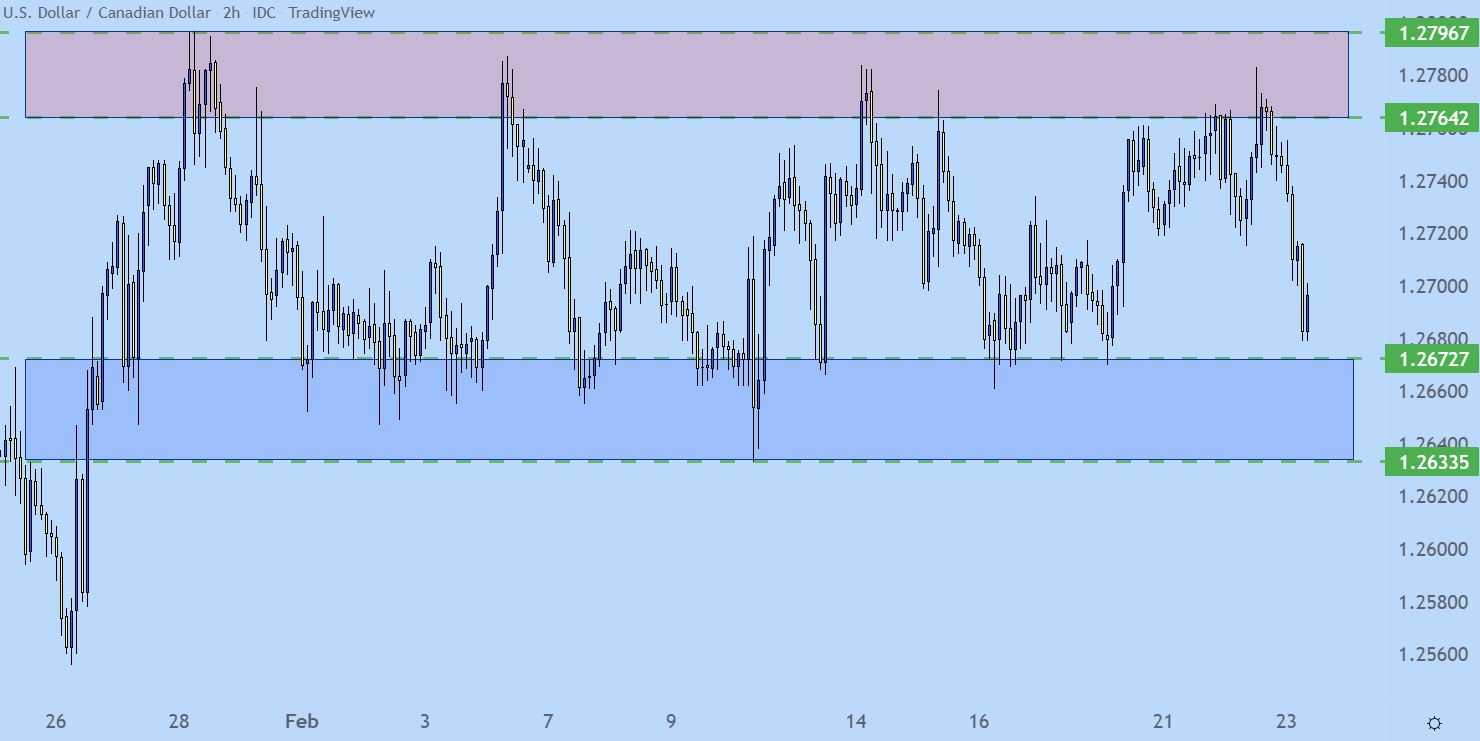
Chart prepared by James Stanley; USDCAD on Tradingview
--- Written by James Stanley, Senior Strategist for DailyFX.com
Contact and follow James on Twitter: @JStanleyFX


