


US Dollar Talking Points:
- The US Dollar is pulling back from a zone of resistance looked at yesterday between 96.37-96.47.
- While I’m still bullish USD long-term, I think short and intermediate-terms favor downside. The currency became very overbought as rate hikes were priced-in. The ‘war bid’ has helped to prod the USD higher over the past week and that’s a scenario that I’d be somewhat comfortable fading on currencies, especially considering my generally bearish bias on stocks.
- The analysis contained in article relies on price action and chart formations. To learn more about price action or chart patterns, check out our DailyFX Education section.
Trade Smarter - Sign up for the DailyFX Newsletter
Receive timely and compelling market commentary from the DailyFX team
I looked at a litany of setups in this webinar, but as I said up front, much near-term price action seems to be driven by threats, worries or concerns about the Russia-Ukraine scenario. And given the headlines that we’ve already seen today it’s clear that this isn’t leaving the front page anytime soon.
With that said, there does appear to be some alignment in themes, mainly with equity weakness which was already an attractive theme based on how sentiment has shifted based on the recent items around the Federal Reserve. With Russia-Ukraine bringing another possible risk to the table, one which could drive oil prices higher worsening the impact of inflation, bearish equity plays could remain as attractive.
Currencies are a bit different at the moment: The US Dollar had put in an impressive bout of weakness, closing as a bearish engulf on the weekly two weeks ago, helped along by the ECB. But then last week saw Russia-Ukraine take over the headlines and both Gold and USD were bid as pressure re-appeared in equities.
US Dollar
I’m of the mind that rate hikes are adequately priced-in here and the recent topside movement has been driven by prospect of war. And perhaps that does happen, but I feel that the pair needs a deeper retracement before it’s primed for a longer-term bullish move. The 95 psychological level is big here, and a push below that might do it, although the low at 94.63 seems a bit more opportunistic for some element of capitulation.
US Dollar Daily Price Chart
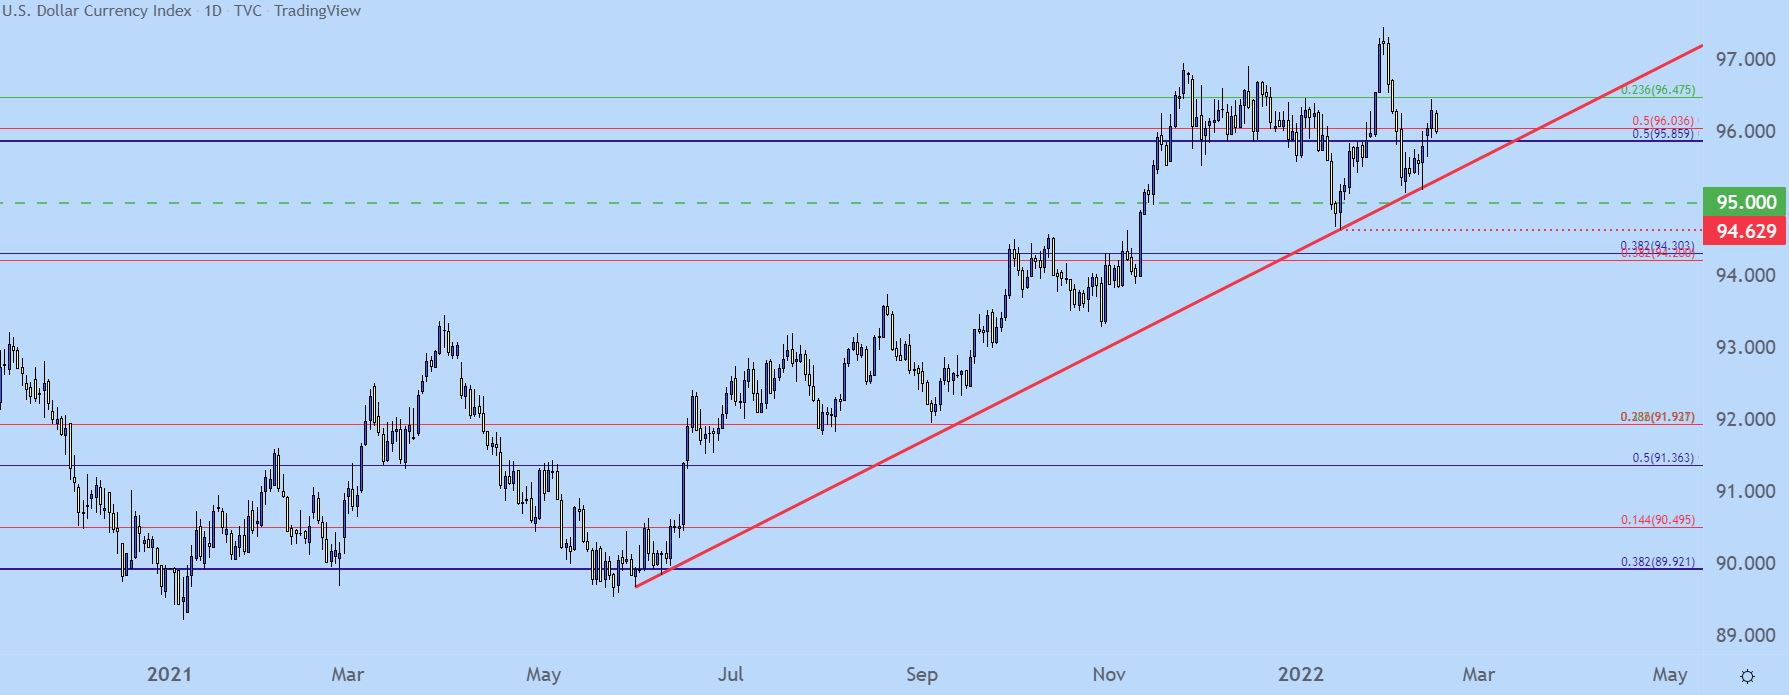
Chart prepared by James Stanley; USD, DXY on Tradingview
EUR/USD Feast or Famine
Many market participants seemed almost incredulous when the ECB started to open the door to ‘less loose’ policy at some point later in the year.
EUR/USD broke out nonetheless, and set a fresh three-month-high while falling short of a resistance test at the 1.1500 psychological level.
And, to be sure, the Euro doesn’t make many fundamental arguments very attractive: But as I said later in the webinar, price often leads, and this may be what we’ve seen over the past couple of weeks, particularly if US rate hikes were already adequately priced-in to the USD.
EUR/USD Daily Price Chart
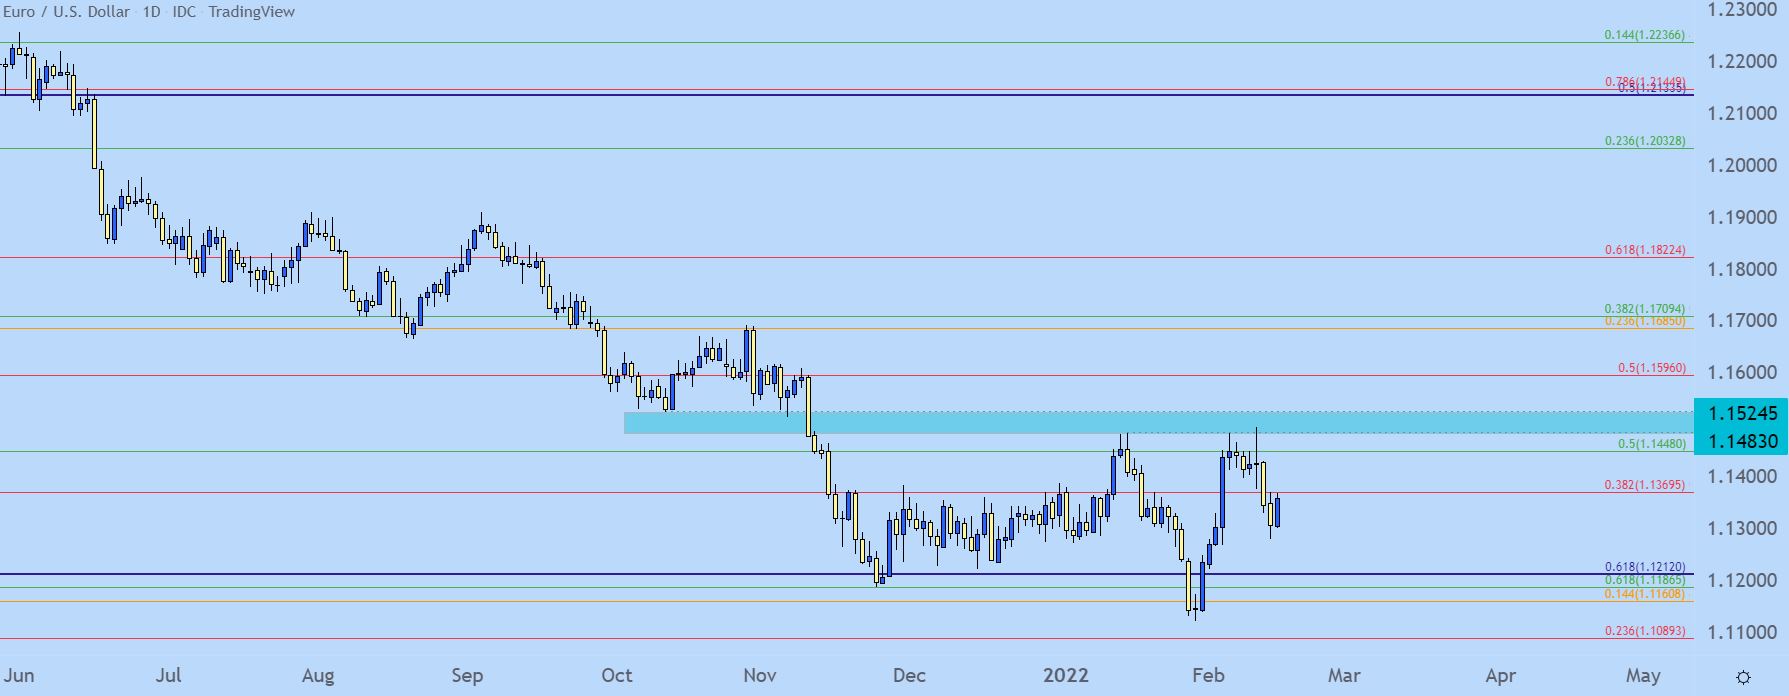
Chart prepared by James Stanley; EURUSD on Tradingview
GBP/USD: The Bulls' Chance is Slipping By
The old saying of ‘give an inch and they take a mile’ is somewhat relevant here in GBP/USD.
The pair has been sitting on support for over a week now, and there’s a lot of confluence in a really tight area on the chart. There’s a bull flag with a trendline projection right around the 1.3500 psychological level.
The only problem is that, to date, GBP/USD bulls seem absolutely uninterested. And this makes the premise of a violation of support look more probabilistic to me, and this could be an attractive way to price-in strength for the USD.
GBP/USD Four-Hour Price Chart

Chart prepared by James Stanley; GBPUSD on Tradingview
AUD/USD Falling Wedge
This is a longer-term setup but this points to the potential for prolonged USD-weakness. The .7000 big figure is a massive spot of importance in AUD/USD, as has been the case for the past couple of years.
Sellers have been reticent to push below that level and that’s allowed for a falling wedge to build, which is a bullish reversal formation. This keeps the eye on topside for AUD/USD and that’s even more attractive should USD-weakness take-over.
AUD/USD Weekly Price Chart
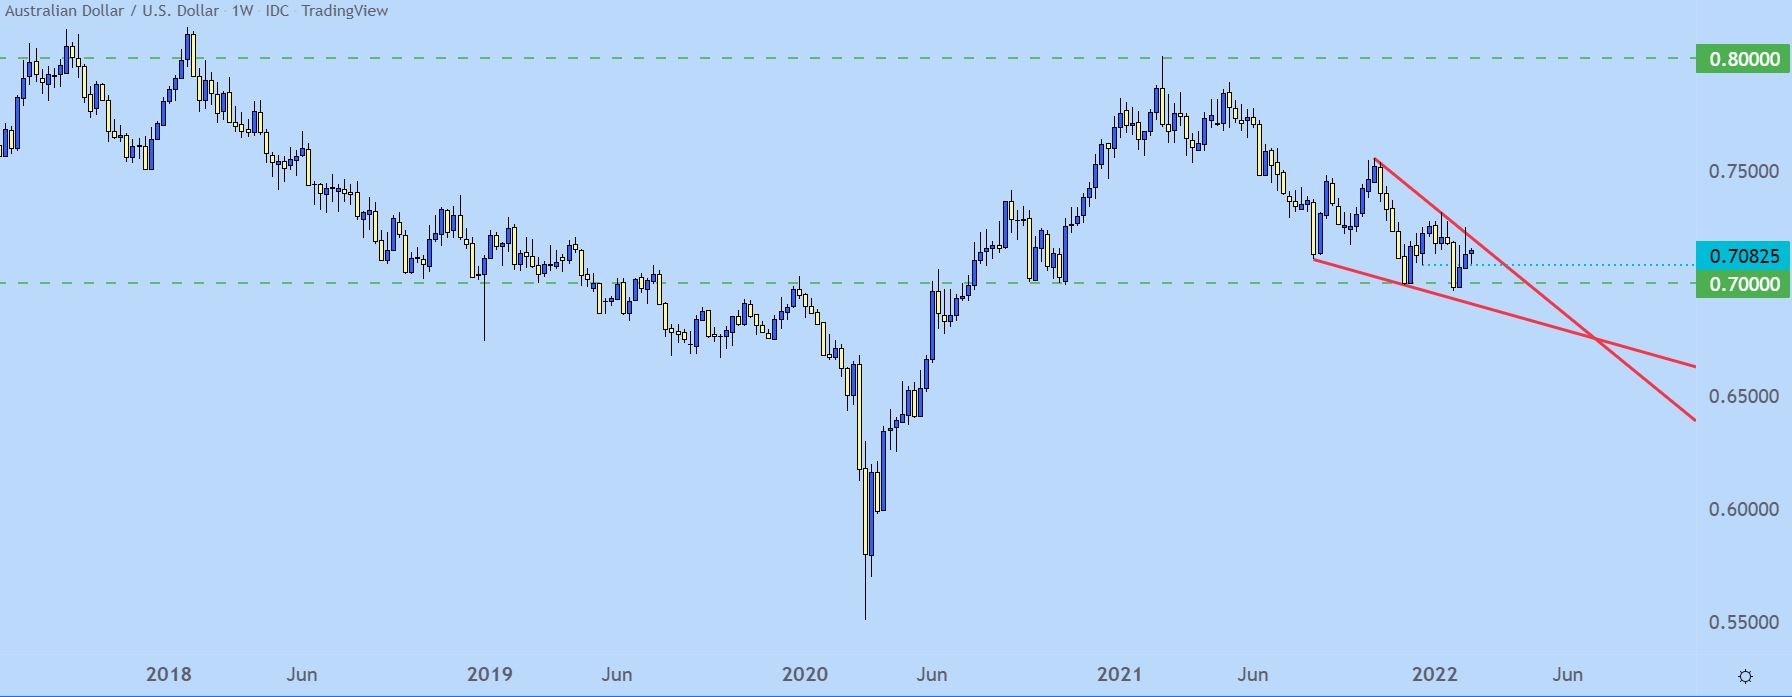
Chart prepared by James Stanley; AUDUSD on Tradingview
USD/CAD Range Remains
The range in USD/CAD has been brewing for all of February and, so far, it’s been pretty clean. Prices are nearing the resistance side of that range, which could open the door for some USD-weakness. If buyers are able to take out the highs, then bullish breakouts can open with eyes towards 1.2900 and 1.2950, which twice-capped last year’s topside runs in USD/CAD.
But, until the range is broken mean reversion is the name of the game.

USD/CAD Four-Hour Price Chart
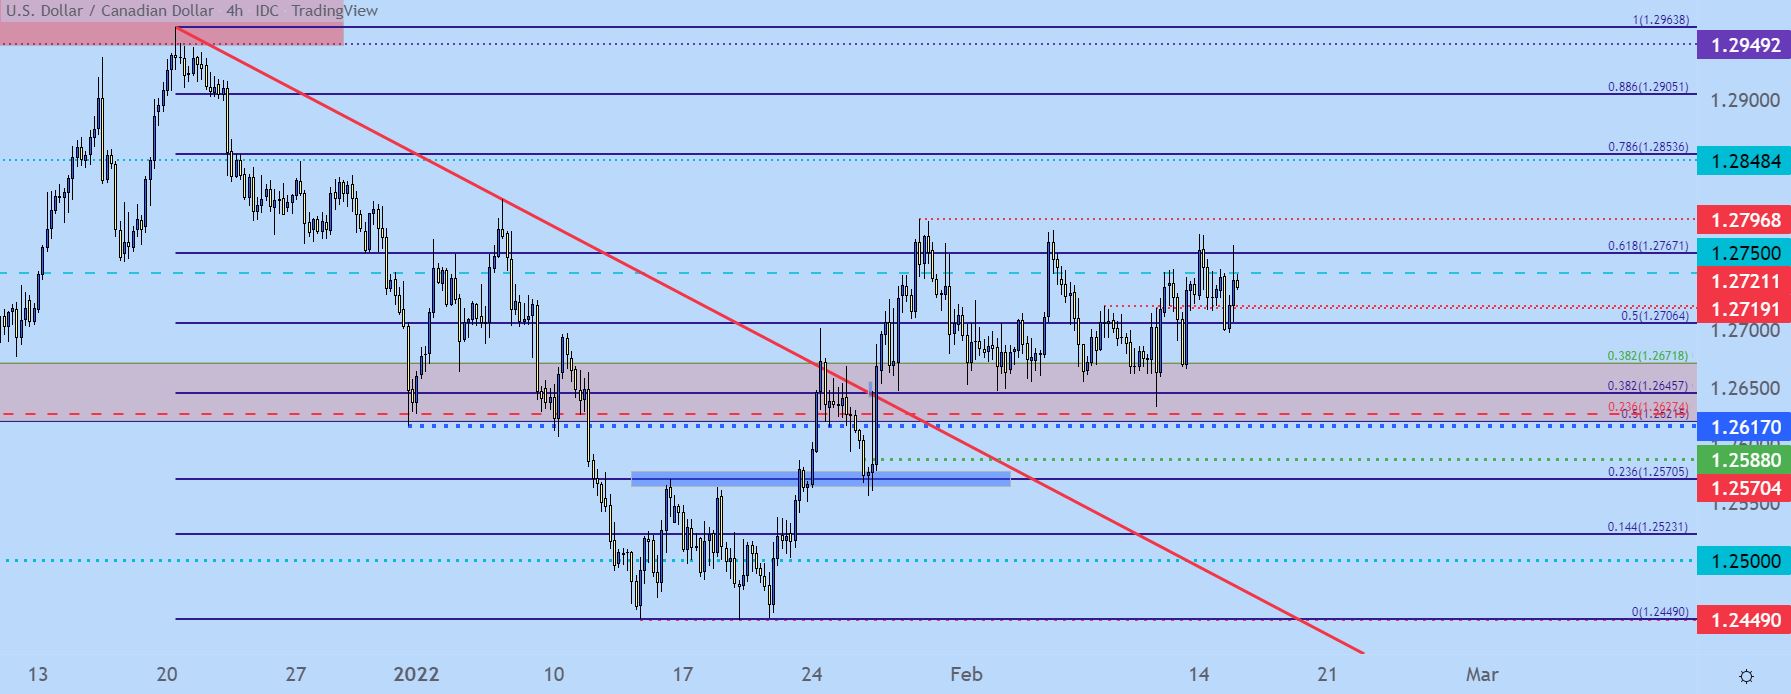
Chart prepared by James Stanley; USDCAD on Tradingview
--- Written by James Stanley, Senior Strategist for DailyFX.com
Contact and follow James on Twitter: @JStanleyFX


