


US Dollar, EUR/USD, GBP/USD, AUD/USD Talking Points:
- The US Dollar is plummeting after last week’s aggressive breakout, driven by fears of a negative NFP print this Friday.
- The Dollar deluge is helping to lift EUR/USD and GBP/USD ahead of their rate decisions tomorrow. Meanwhile, AUD/USD continues to gain after a trip below the .7000 big fig last week. Which pairs are attractive for fading this USD weakness and which are more attractive for looking towards bearish continuation?
- The analysis contained in article relies on price action and chart formations. To learn more about price action or chart patterns, check out our DailyFX Education section.

It’s been a wild ride in the US Dollar over the past few weeks and given the economic calendar, that looks set to continue with Non-Farm Payrolls coming up on Friday. There’s also a services PMI release on Thursday morning but it’s the jobs report that seems to have so many traders’ attention. This morning’s ADP report printed at an abysmal -310k versus an expectation of +201k. And while ADP is a lousy predictor of NFP, this echoes the circulating narrative that’s starting to expect a negative NFP print come Friday.
This could be a stark change from the data that’s driven the Fed into a hiking posture as we heard about at last week’s FOMC rate decision. While inflation continued to rage throughout last year, the Fed continually pointed at weakness in the labor market as a reason not to hike. Even in December, when the Fed started to open the door to 2-3 hikes in 2022, Powell opined that lift-off wouldn’t take place until the Fed was comfortable with the U.S. economy being at ‘full employment.’
This negative data on employment is causing a re-think of that, at least in some markets. Rates remain elevated but the US Dollar has put in a deluge, erasing the entirety of the Fed-fueled gain that showed from last Wednesday.
As I talked about on Monday, the US Dollar built in an evening star formation – marked with a strong bullish candle on Thursday followed by a doji on Friday, with the formation completing after the Monday reversal.
Evening star formations are often followed with the aim of bearish reversals, often associated with topping in a market. And so far this week, price action has moved in that direction with more weakness on Tuesday and so far on Wednesday.
US Dollar Daily Price Chart: Evening Star
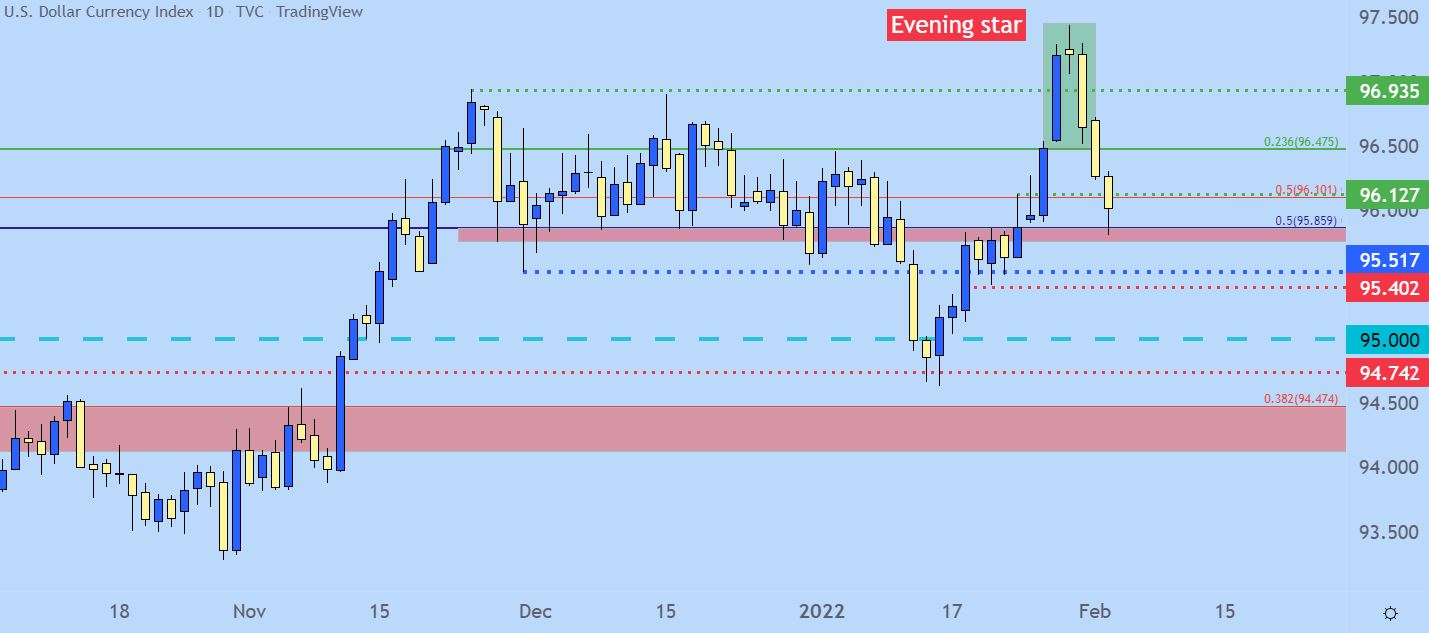
Chart prepared by James Stanley; USD, DXY on Tradingview
US Dollar: Back to Range Support
At this point, the USD is holding support at a very familiar level of 95.86. This price was in-play quite a bit last year and it has some long-term reference, as this is the 50% marker of the 2001-2008 major move in the currency. This price helped to set range support through December and into the New Year. Most recently, it showed as short-term resistance-turned-support earlier in the month as bulls were grinding prices higher.
Also of note – RSI on the four-hour chart has made a quick trip down towards oversold territory without actually crossing the 30 line, at least yet. But, this does highlight the recent volatility as this indicator flashed an oversold reading a few weeks ago after the 7% CPI print out of the U.S., only to move into an oversold state after last week’s FOMC.
While RSI can be a terrible timing indicator, it does highlight the danger of aggressively selling an already oversold market, particularly when testing a big spot of longer-term support. This can also allude to the potential for a near-term bottom being in-place before too long, keeping the door open for bullish USD scenarios as we approach a couple of key rate decisions on the calendar for tomorrow.
US Dollar Four-Hour Price Chart
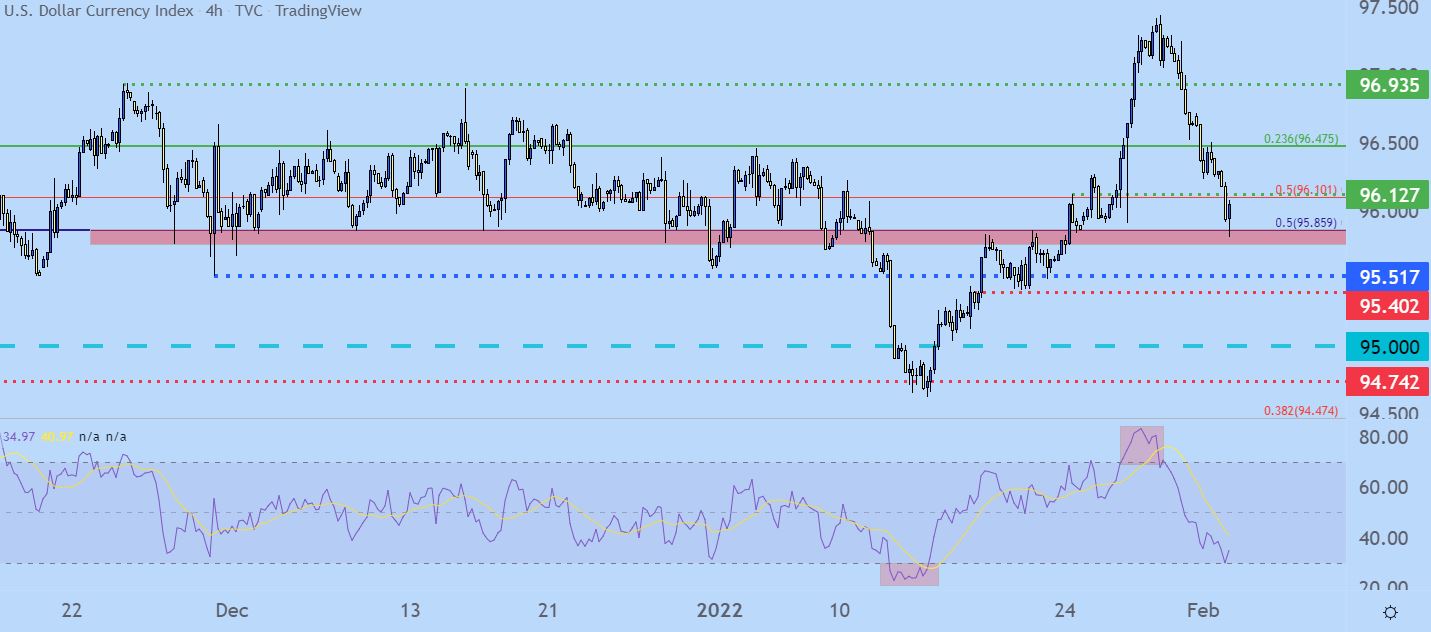
Chart prepared by James Stanley; USD, DXY on Tradingview
EUR/USD Morning Star
The mirror image of that evening star in the US Dollar is the morning star formation that brewed in EUR/USD. I wrote about that yesterday and at the time, EUR/USD was holding resistance at a familiar area of 1.1272.
Prices have since broken out and appear on the way up to the next resistance level, which I have plotted at prior resistance from an ascending triangle formation that filled-in a few weeks ago; and that’s at 1.1374.
The big driver here comes from rising rate expectations out of the Euro-zone, as difficult as that might be to believe. That, combined with expectations for a negative NFP print out of the U.S. have turned the fundamental tables 180 degrees from last week and that, of course, has shown in near-term price action.
This could, however, set up for an interesting fade possibility ahead of tomorrow’s ECB rate decision. Prices in EUR/USD on the four-hour chart haven’t yet gotten into overbought territory – but the recovery so far has been sharp and there may be some additional forward push ahead of tomorrow’s rate decision. Traders can look for a push back-below 1272 to highlight bears re-entering the equation, at which point the prior zone of support comes into play around 1187-1212.
EUR/USD Four-Hour Price Chart
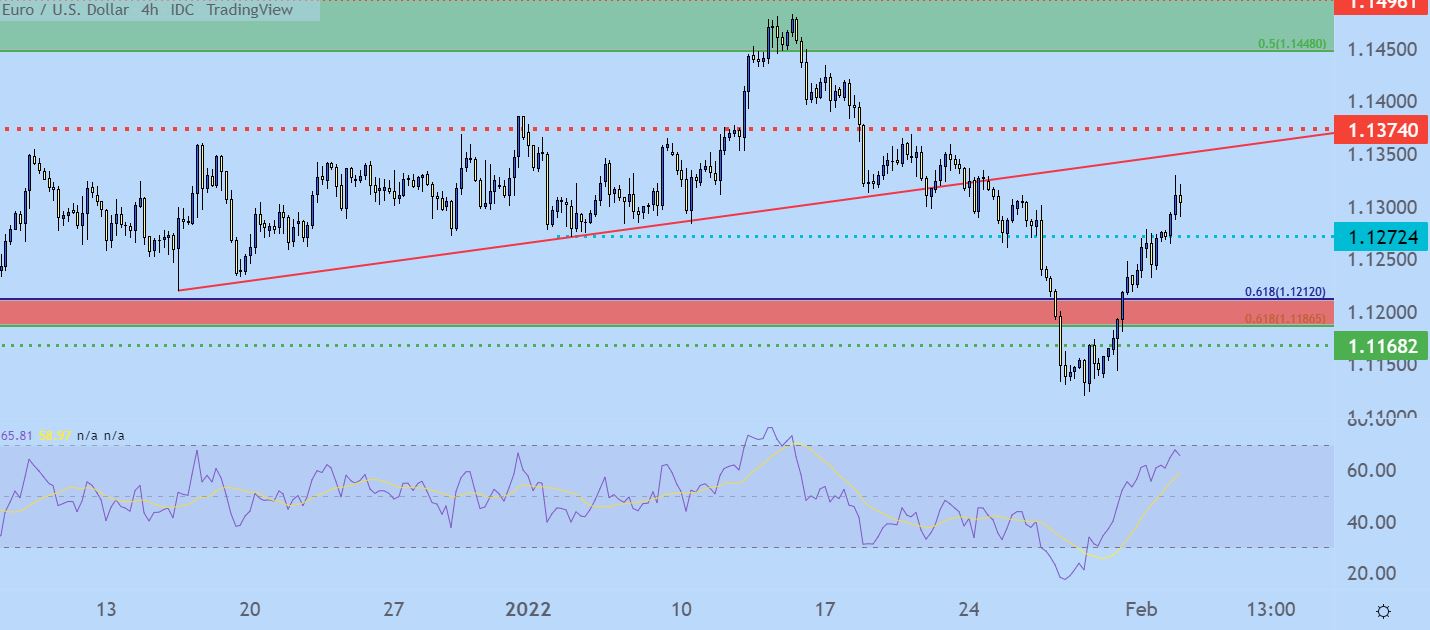
Chart prepared by James Stanley; EURUSD on Tradingview
GBP/USD
Cable has posed a strong four-day rally after last week’s sell-off erased 61.8% of the prior bullish trend. Yesterday saw bulls battle back to the 1.3500 psychological level but that’s been followed by another topside breakout with a trip up to Fibonacci resistance at 1.3581. This is the 23.6% retracement of the 2020-2021 major move, and the longer-term bull flag remains in order.
This can remain as an interesting option for short-USD scenarios. The four-hour chart is currently overbought, so a pullback to short-term support at prior resistance around 1.3524 seems to be an attractive way of moving forward. If the pullback doesn’t show, caution should be urged up to the 1.3600 handle, which was a prior zone of support-turned-resistance.
GBP/USD Weekly Price Chart
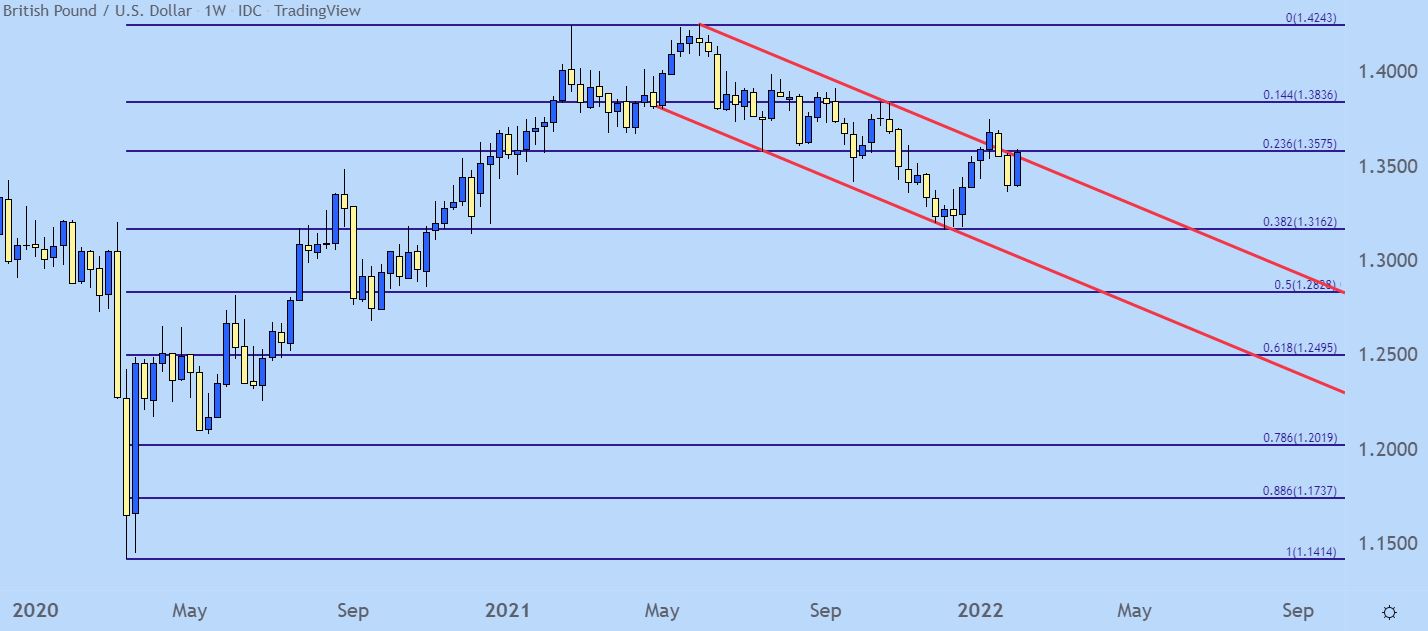
Chart prepared by James Stanley; GBPUSD on Tradingview
AUD/USD Bounce from the Big Fig
There was a rate decision out of Australia earlier in the week. Like many other major FX pairs, USD-weakness has absolutely over-taken everything else.
In AUD/USD, however, that backdrop is complicated by the fact that prices pushed below a major spot on the chart last week at the .7000 handle. This has been a major sticking point in AUD/USD price action for a couple of years now. Buyers have, so far, refused to give much way below that price, and this has allowed for the build of a falling wedge formation.
Such formations are often approached with the aim of bullish reversals. Of course, that scenario seems as though it’d need some help from the USD with continued weakness, but the formation is what it is, and this can keep the door open for upside until it’s negated.
AUD/USD Weekly Price Chart
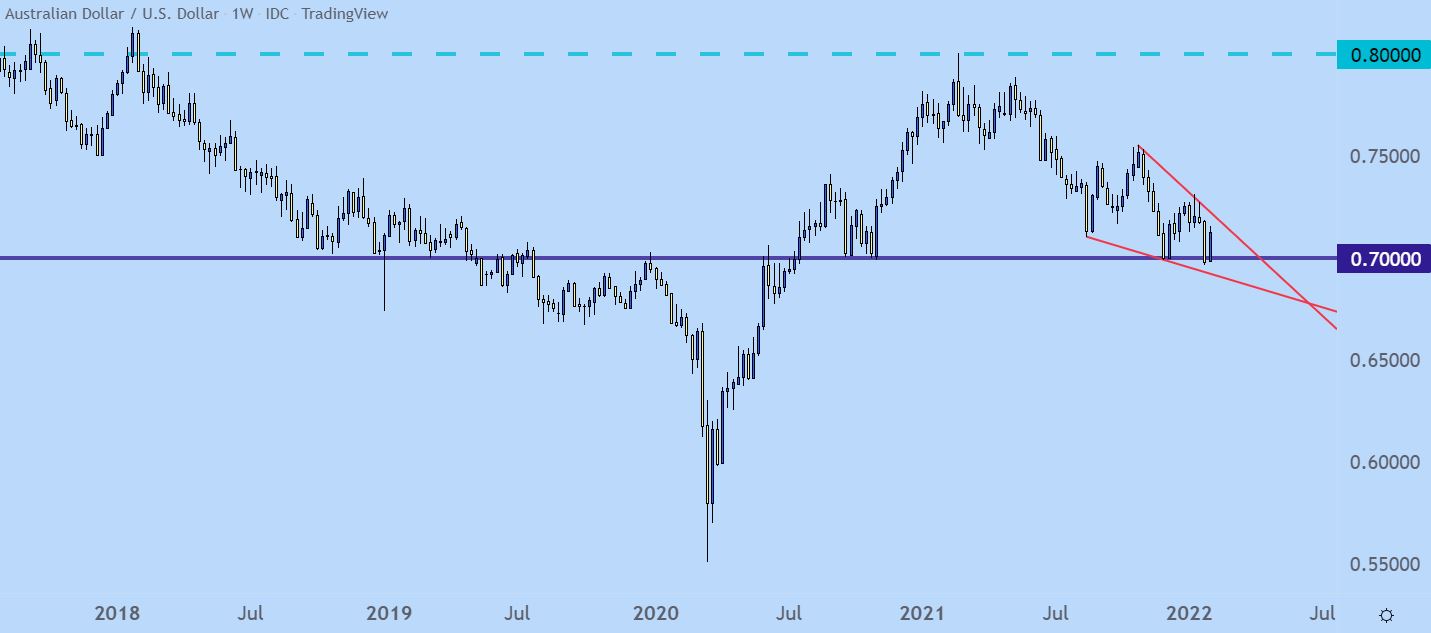
Chart prepared by James Stanley; AUDUSD on Tradingview
--- Written by James Stanley, Senior Strategist for DailyFX.com
Contact and follow James on Twitter: @JStanleyFX


